ParamountGroup PGRE full analysis,charts,indicators,moving averages,SMA,DMA,EMA,ADX,MACD,RSIParamount Group PGRE WideScreen charts, DMA,SMA,EMA technical analysis, forecast prediction, by indicators ADX,MACD,RSI,CCI USA stock exchange
operates under Consumer Services sector & deals in Real Estate Investment Trusts
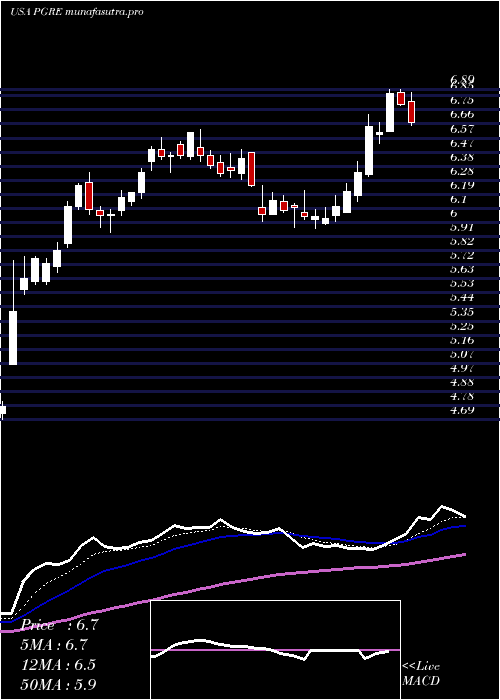
Daily price and charts and targets ParamountGroup Strong Daily Stock price targets for ParamountGroup PGRE are 6.58 and 6.59 | Daily Target 1 | 6.57 | | Daily Target 2 | 6.58 | | Daily Target 3 | 6.5833333333333 | | Daily Target 4 | 6.59 | | Daily Target 5 | 6.59 |
Daily price and volume Paramount Group
| Date |
Closing |
Open |
Range |
Volume |
Thu 04 December 2025 |
6.58 (-0.15%) |
6.59 |
6.58 - 6.59 |
0.7449 times |
Wed 03 December 2025 |
6.59 (0.15%) |
6.59 |
6.58 - 6.59 |
0.9562 times |
Tue 02 December 2025 |
6.58 (0%) |
6.59 |
6.58 - 6.59 |
0.7188 times |
Mon 01 December 2025 |
6.58 (-0.15%) |
6.59 |
6.58 - 6.59 |
0.8643 times |
Fri 28 November 2025 |
6.59 (0.15%) |
6.59 |
6.58 - 6.59 |
0.6487 times |
Wed 26 November 2025 |
6.58 (0%) |
6.57 |
6.57 - 6.59 |
1.0536 times |
Tue 25 November 2025 |
6.58 (0%) |
6.57 |
6.57 - 6.59 |
2.0184 times |
Mon 24 November 2025 |
6.58 (0.15%) |
6.56 |
6.56 - 6.58 |
1.1557 times |
Fri 21 November 2025 |
6.57 (0.15%) |
6.56 |
6.56 - 6.57 |
0.848 times |
Thu 20 November 2025 |
6.56 (0%) |
6.57 |
6.55 - 6.57 |
0.9915 times |
Wed 19 November 2025 |
6.56 (0.15%) |
6.55 |
6.55 - 6.57 |
4.008 times |
Weekly price and charts ParamountGroup Strong weekly Stock price targets for ParamountGroup PGRE are 6.58 and 6.59 | Weekly Target 1 | 6.57 | | Weekly Target 2 | 6.58 | | Weekly Target 3 | 6.5833333333333 | | Weekly Target 4 | 6.59 | | Weekly Target 5 | 6.59 |
Weekly price and volumes for Paramount Group
| Date |
Closing |
Open |
Range |
Volume |
Thu 04 December 2025 |
6.58 (-0.15%) |
6.59 |
6.58 - 6.59 |
0.5138 times |
Fri 28 November 2025 |
6.59 (0.3%) |
6.56 |
6.56 - 6.59 |
0.7629 times |
Fri 21 November 2025 |
6.57 (0.31%) |
6.55 |
6.54 - 6.57 |
1.3083 times |
Fri 14 November 2025 |
6.55 (0%) |
6.56 |
6.55 - 6.58 |
0.5627 times |
Fri 07 November 2025 |
6.55 (0.15%) |
6.55 |
6.54 - 6.56 |
0.7021 times |
Fri 31 October 2025 |
6.54 (0%) |
6.53 |
6.53 - 6.55 |
0.5068 times |
Fri 31 October 2025 |
6.54 (0.31%) |
6.53 |
6.52 - 6.55 |
1.5137 times |
Fri 24 October 2025 |
6.52 (-0.31%) |
6.54 |
6.52 - 6.54 |
0.8147 times |
Fri 17 October 2025 |
6.54 (0%) |
6.54 |
6.52 - 6.55 |
2.1628 times |
Tue 07 October 2025 |
6.54 (0.15%) |
6.53 |
6.52 - 6.54 |
1.1523 times |
Fri 03 October 2025 |
6.53 (0.15%) |
6.53 |
6.50 - 6.54 |
3.3983 times |
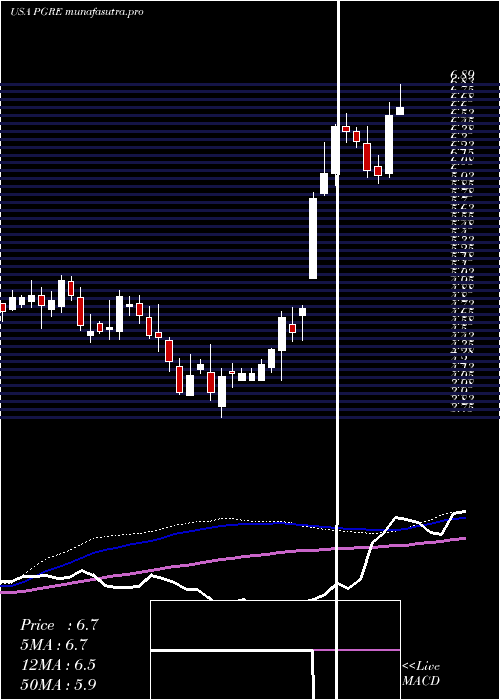
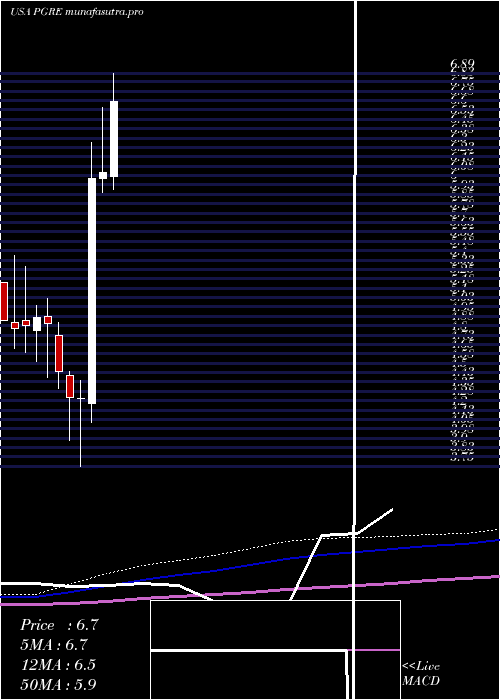
Monthly price and charts ParamountGroup Strong monthly Stock price targets for ParamountGroup PGRE are 6.58 and 6.59 | Monthly Target 1 | 6.57 | | Monthly Target 2 | 6.58 | | Monthly Target 3 | 6.5833333333333 | | Monthly Target 4 | 6.59 | | Monthly Target 5 | 6.59 |
Monthly price and volumes Paramount Group
| Date |
Closing |
Open |
Range |
Volume |
Thu 04 December 2025 |
6.58 (-0.15%) |
6.59 |
6.58 - 6.59 |
0.0712 times |
Fri 28 November 2025 |
6.59 (0.76%) |
6.55 |
6.54 - 6.59 |
0.4624 times |
Fri 31 October 2025 |
6.54 (0%) |
6.53 |
6.50 - 6.55 |
1.122 times |
Tue 30 September 2025 |
6.54 (-9.17%) |
7.11 |
6.51 - 7.85 |
2.4268 times |
Fri 29 August 2025 |
7.20 (17.65%) |
6.01 |
6.00 - 7.26 |
1.2033 times |
Thu 31 July 2025 |
6.12 (0.33%) |
6.07 |
5.75 - 6.89 |
1.1006 times |
Mon 30 June 2025 |
6.10 (0.83%) |
6.05 |
5.94 - 6.62 |
0.9325 times |
Fri 30 May 2025 |
6.05 (41.03%) |
4.25 |
4.10 - 6.34 |
1.1391 times |
Wed 30 April 2025 |
4.29 (-0.23%) |
4.29 |
3.75 - 4.44 |
1.0575 times |
Mon 31 March 2025 |
4.30 (-4.66%) |
4.48 |
3.96 - 4.51 |
0.4847 times |
Fri 28 February 2025 |
4.51 (-7.77%) |
4.80 |
4.37 - 4.90 |
0.25 times |
DMA SMA EMA moving averages of Paramount Group PGRE
DMA (daily moving average) of Paramount Group PGRE
| DMA period | DMA value | | 5 day DMA | 6.58 | | 12 day DMA | 6.58 | | 20 day DMA | 6.57 | | 35 day DMA | 6.55 | | 50 day DMA | 6.55 | | 100 day DMA | 6.65 | | 150 day DMA | 6.33 | | 200 day DMA | 5.82 | EMA (exponential moving average) of Paramount Group PGRE
| EMA period | EMA current | EMA prev | EMA prev2 | | 5 day EMA | 6.58 | 6.58 | 6.58 | | 12 day EMA | 6.56 | 6.56 | 6.56 | | 20 day EMA | 6.57 | 6.57 | 6.57 | | 35 day EMA | 6.57 | 6.57 | 6.57 | | 50 day EMA | 6.57 | 6.57 | 6.57 |
SMA (simple moving average) of Paramount Group PGRE
| SMA period | SMA current | SMA prev | SMA prev2 | | 5 day SMA | 6.58 | 6.58 | 6.58 | | 12 day SMA | 6.58 | 6.57 | 6.57 | | 20 day SMA | 6.57 | 6.56 | 6.56 | | 35 day SMA | 6.55 | 6.55 | 6.55 | | 50 day SMA | 6.55 | 6.54 | 6.54 | | 100 day SMA | 6.65 | 6.65 | 6.64 | | 150 day SMA | 6.33 | 6.31 | 6.3 | | 200 day SMA | 5.82 | 5.81 | 5.8 |
|
|
