ProcterGamble PG full analysis,charts,indicators,moving averages,SMA,DMA,EMA,ADX,MACD,RSIProcter Gamble PG WideScreen charts, DMA,SMA,EMA technical analysis, forecast prediction, by indicators ADX,MACD,RSI,CCI USA stock exchange
operates under Basic Industries sector & deals in Package Goods Cosmetics
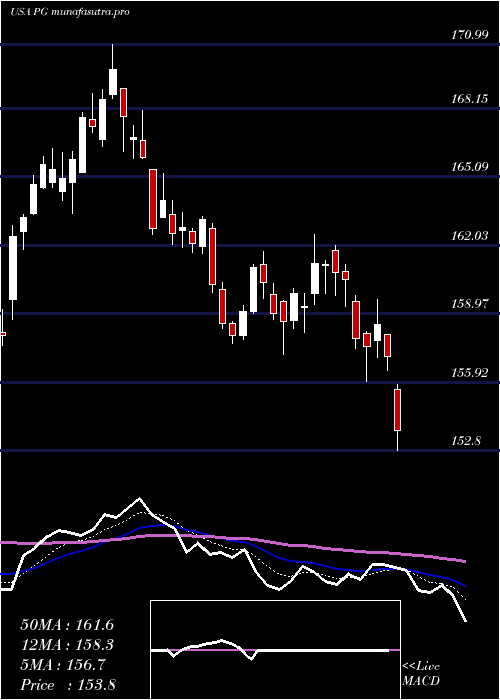
Daily price and charts and targets ProcterGamble Strong Daily Stock price targets for ProcterGamble PG are 143.48 and 146.4 | Daily Target 1 | 142.84 | | Daily Target 2 | 144.11 | | Daily Target 3 | 145.76333333333 | | Daily Target 4 | 147.03 | | Daily Target 5 | 148.68 |
Daily price and volume Procter Gamble
| Date |
Closing |
Open |
Range |
Volume |
Thu 04 December 2025 |
145.37 (-0.91%) |
146.85 |
144.50 - 147.42 |
0.747 times |
Wed 03 December 2025 |
146.71 (0.62%) |
145.92 |
145.86 - 148.29 |
1.2883 times |
Tue 02 December 2025 |
145.81 (-1.11%) |
148.11 |
142.51 - 148.11 |
1.2467 times |
Mon 01 December 2025 |
147.44 (-0.49%) |
148.10 |
147.35 - 148.89 |
1.1633 times |
Fri 28 November 2025 |
148.16 (-0.07%) |
147.80 |
147.18 - 148.71 |
0.6645 times |
Wed 26 November 2025 |
148.26 (-0.15%) |
148.70 |
147.61 - 148.97 |
0.5672 times |
Tue 25 November 2025 |
148.48 (1.05%) |
147.17 |
147.04 - 148.65 |
0.6195 times |
Mon 24 November 2025 |
146.94 (-2.64%) |
150.63 |
146.54 - 150.89 |
0.7344 times |
Fri 21 November 2025 |
150.92 (1.84%) |
148.38 |
148.30 - 151.50 |
1.6954 times |
Thu 20 November 2025 |
148.19 (0.82%) |
146.64 |
146.13 - 148.66 |
1.2736 times |
Wed 19 November 2025 |
146.99 (0.01%) |
146.96 |
145.86 - 147.54 |
0.8989 times |
Weekly price and charts ProcterGamble Strong weekly Stock price targets for ProcterGamble PG are 140.75 and 147.13 | Weekly Target 1 | 139.21 | | Weekly Target 2 | 142.29 | | Weekly Target 3 | 145.59 | | Weekly Target 4 | 148.67 | | Weekly Target 5 | 151.97 |
Weekly price and volumes for Procter Gamble
| Date |
Closing |
Open |
Range |
Volume |
Thu 04 December 2025 |
145.37 (-1.88%) |
148.10 |
142.51 - 148.89 |
1.102 times |
Fri 28 November 2025 |
148.16 (-1.83%) |
150.63 |
146.54 - 150.89 |
0.641 times |
Fri 21 November 2025 |
150.92 (2.2%) |
147.75 |
145.01 - 151.50 |
1.4938 times |
Fri 14 November 2025 |
147.67 (0.47%) |
146.38 |
144.09 - 149.38 |
1.3274 times |
Fri 07 November 2025 |
146.98 (-2.25%) |
148.55 |
144.46 - 149.50 |
0.9871 times |
Fri 31 October 2025 |
150.37 (0%) |
148.71 |
148.53 - 151.10 |
0.2775 times |
Fri 31 October 2025 |
150.37 (-1.45%) |
151.61 |
148.47 - 153.17 |
1.2491 times |
Fri 24 October 2025 |
152.59 (0.79%) |
151.59 |
150.58 - 157.78 |
1.004 times |
Fri 17 October 2025 |
151.40 (-0.75%) |
149.00 |
146.97 - 152.03 |
1.5231 times |
Tue 07 October 2025 |
152.54 (0.03%) |
152.49 |
150.05 - 153.17 |
0.395 times |
Fri 03 October 2025 |
152.50 (0%) |
152.42 |
151.41 - 154.38 |
1.1484 times |
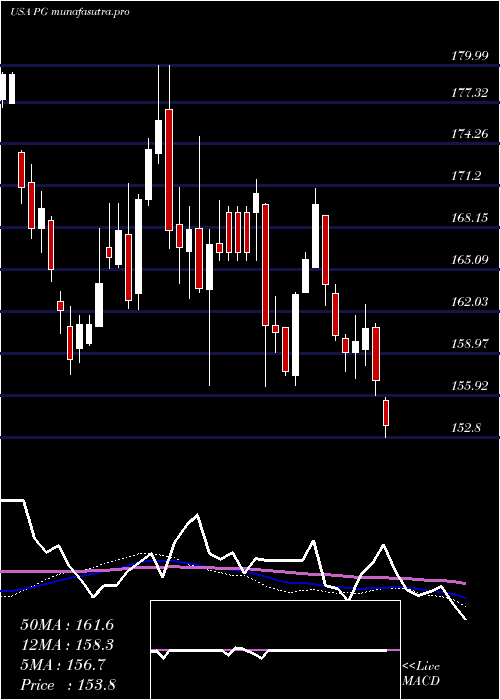
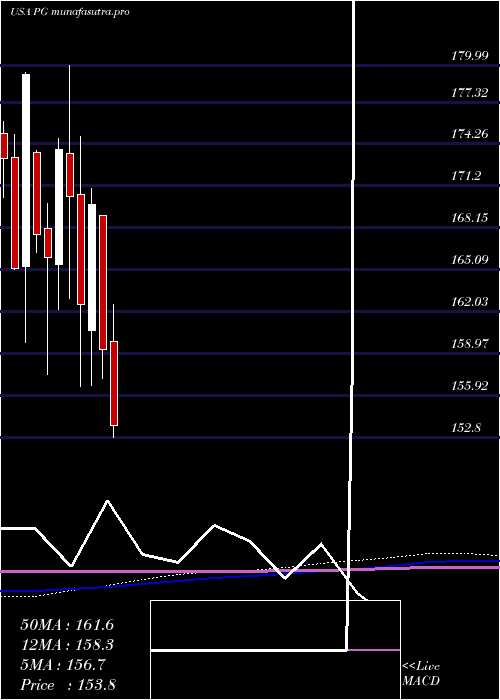
Monthly price and charts ProcterGamble Strong monthly Stock price targets for ProcterGamble PG are 140.75 and 147.13 | Monthly Target 1 | 139.21 | | Monthly Target 2 | 142.29 | | Monthly Target 3 | 145.59 | | Monthly Target 4 | 148.67 | | Monthly Target 5 | 151.97 |
Monthly price and volumes Procter Gamble
| Date |
Closing |
Open |
Range |
Volume |
Thu 04 December 2025 |
145.37 (-1.88%) |
148.10 |
142.51 - 148.89 |
0.2159 times |
Fri 28 November 2025 |
148.16 (-1.47%) |
148.55 |
144.09 - 151.50 |
0.8718 times |
Fri 31 October 2025 |
150.37 (-2.13%) |
153.70 |
146.97 - 157.78 |
0.9877 times |
Tue 30 September 2025 |
153.65 (-2.16%) |
157.36 |
150.97 - 161.67 |
1.0555 times |
Fri 29 August 2025 |
157.04 (4.37%) |
151.77 |
150.21 - 161.03 |
0.9394 times |
Thu 31 July 2025 |
150.47 (-5.55%) |
159.88 |
149.91 - 162.53 |
1.3438 times |
Mon 30 June 2025 |
159.32 (-6.22%) |
169.02 |
157.17 - 169.04 |
1.0672 times |
Fri 30 May 2025 |
169.89 (4.5%) |
160.65 |
156.69 - 170.99 |
1.0318 times |
Wed 30 April 2025 |
162.57 (-4.61%) |
170.57 |
156.58 - 174.80 |
1.3357 times |
Mon 31 March 2025 |
170.42 (-1.97%) |
173.58 |
162.99 - 179.99 |
1.1511 times |
Fri 28 February 2025 |
173.84 (4.73%) |
165.47 |
162.20 - 174.65 |
0.9479 times |
DMA SMA EMA moving averages of Procter Gamble PG
DMA (daily moving average) of Procter Gamble PG
| DMA period | DMA value | | 5 day DMA | 146.7 | | 12 day DMA | 147.52 | | 20 day DMA | 147.34 | | 35 day DMA | 148.67 | | 50 day DMA | 149.57 | | 100 day DMA | 152.93 | | 150 day DMA | 155.91 | | 200 day DMA | 159 | EMA (exponential moving average) of Procter Gamble PG
| EMA period | EMA current | EMA prev | EMA prev2 | | 5 day EMA | 146.5 | 147.06 | 147.23 | | 12 day EMA | 147.18 | 147.51 | 147.65 | | 20 day EMA | 147.69 | 147.93 | 148.06 | | 35 day EMA | 148.8 | 149 | 149.13 | | 50 day EMA | 149.94 | 150.13 | 150.27 |
SMA (simple moving average) of Procter Gamble PG
| SMA period | SMA current | SMA prev | SMA prev2 | | 5 day SMA | 146.7 | 147.28 | 147.63 | | 12 day SMA | 147.52 | 147.56 | 147.64 | | 20 day SMA | 147.34 | 147.36 | 147.38 | | 35 day SMA | 148.67 | 148.73 | 148.8 | | 50 day SMA | 149.57 | 149.78 | 149.99 | | 100 day SMA | 152.93 | 153.06 | 153.17 | | 150 day SMA | 155.91 | 156.02 | 156.1 | | 200 day SMA | 159 | 159.13 | 159.25 |
|
|
