InvescoDividend PFM full analysis,charts,indicators,moving averages,SMA,DMA,EMA,ADX,MACD,RSIInvesco Dividend PFM WideScreen charts, DMA,SMA,EMA technical analysis, forecast prediction, by indicators ADX,MACD,RSI,CCI USA stock exchange
operates under N A sector & deals in N A
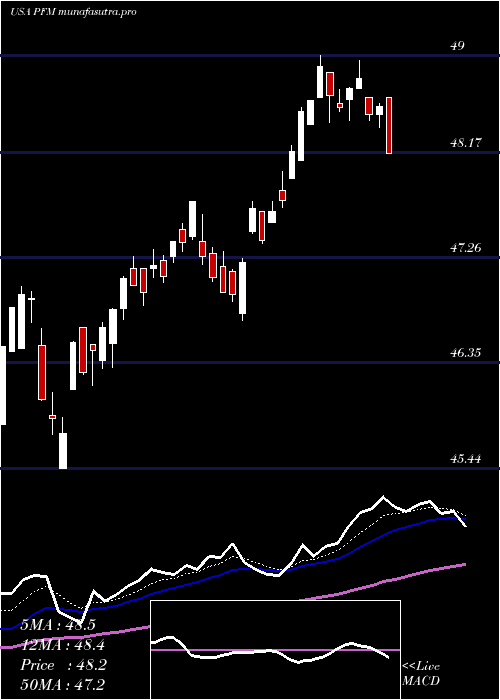
Daily price and charts and targets InvescoDividend Strong Daily Stock price targets for InvescoDividend PFM are 51 and 51.25 | Daily Target 1 | 50.82 | | Daily Target 2 | 50.93 | | Daily Target 3 | 51.073333333333 | | Daily Target 4 | 51.18 | | Daily Target 5 | 51.32 |
Daily price and volume Invesco Dividend
| Date |
Closing |
Open |
Range |
Volume |
Tue 21 October 2025 |
51.03 (-0.02%) |
50.97 |
50.97 - 51.22 |
0.9424 times |
Mon 20 October 2025 |
51.04 (0.67%) |
50.74 |
50.74 - 51.07 |
1.6405 times |
Fri 17 October 2025 |
50.70 (0.36%) |
50.52 |
50.36 - 50.72 |
0.7853 times |
Thu 16 October 2025 |
50.52 (-0.86%) |
51.07 |
50.43 - 51.10 |
0.8028 times |
Wed 15 October 2025 |
50.96 (0.3%) |
51.21 |
50.76 - 51.39 |
1.4572 times |
Tue 14 October 2025 |
50.81 (0.51%) |
50.20 |
50.20 - 50.98 |
0.8028 times |
Mon 13 October 2025 |
50.55 (1.12%) |
50.42 |
50.42 - 50.68 |
0.9424 times |
Fri 10 October 2025 |
49.99 (-1.71%) |
51.08 |
49.99 - 51.08 |
1.178 times |
Thu 09 October 2025 |
50.86 (-0.53%) |
51.19 |
50.79 - 51.22 |
0.6108 times |
Wed 08 October 2025 |
51.13 (0.2%) |
51.17 |
51.00 - 51.22 |
0.8377 times |
Tue 07 October 2025 |
51.03 (-0.27%) |
51.27 |
50.93 - 51.27 |
0.9599 times |
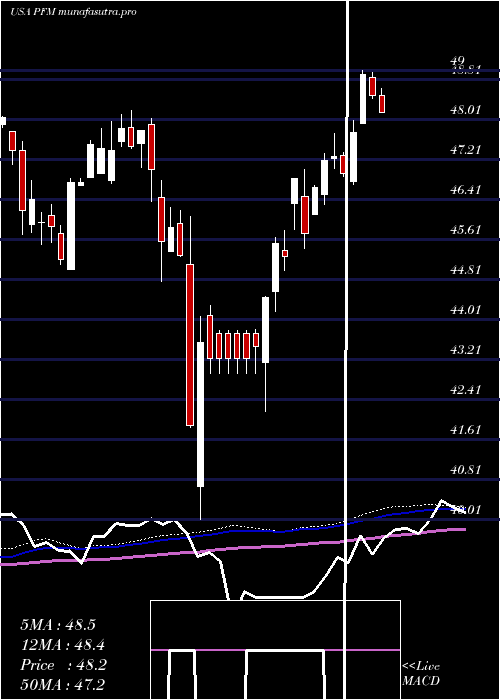
Weekly price and charts InvescoDividend Strong weekly Stock price targets for InvescoDividend PFM are 50.89 and 51.37 | Weekly Target 1 | 50.52 | | Weekly Target 2 | 50.77 | | Weekly Target 3 | 50.996666666667 | | Weekly Target 4 | 51.25 | | Weekly Target 5 | 51.48 |
Weekly price and volumes for Invesco Dividend
| Date |
Closing |
Open |
Range |
Volume |
Tue 21 October 2025 |
51.03 (0.65%) |
50.74 |
50.74 - 51.22 |
0.4326 times |
Fri 17 October 2025 |
50.70 (1.42%) |
50.42 |
50.20 - 51.39 |
0.8024 times |
Fri 10 October 2025 |
49.99 (-2.29%) |
51.29 |
49.99 - 51.29 |
0.8316 times |
Fri 03 October 2025 |
51.16 (1.39%) |
50.67 |
50.29 - 51.40 |
1.0245 times |
Fri 26 September 2025 |
50.46 (-0.57%) |
50.47 |
50.06 - 50.87 |
1.2818 times |
Fri 19 September 2025 |
50.75 (0.24%) |
50.81 |
50.45 - 50.90 |
1.2906 times |
Fri 12 September 2025 |
50.63 (1.79%) |
49.93 |
49.69 - 50.90 |
1.2511 times |
Fri 05 September 2025 |
49.74 (0.28%) |
49.21 |
49.14 - 50.15 |
0.7615 times |
Fri 29 August 2025 |
49.60 (0%) |
49.72 |
49.52 - 49.72 |
0.1432 times |
Fri 29 August 2025 |
49.60 (-0.26%) |
49.75 |
49.35 - 49.75 |
2.1807 times |
Fri 22 August 2025 |
49.73 (0.87%) |
49.32 |
49.14 - 49.91 |
0.9734 times |
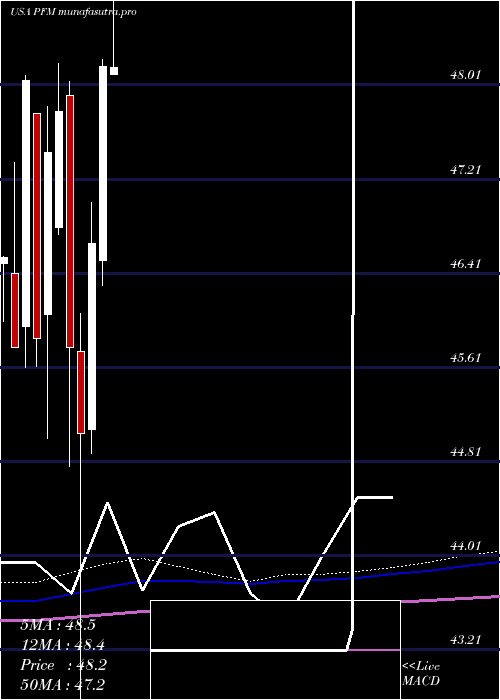
Monthly price and charts InvescoDividend Strong monthly Stock price targets for InvescoDividend PFM are 50.51 and 51.92 | Monthly Target 1 | 49.4 | | Monthly Target 2 | 50.21 | | Monthly Target 3 | 50.806666666667 | | Monthly Target 4 | 51.62 | | Monthly Target 5 | 52.22 |
Monthly price and volumes Invesco Dividend
| Date |
Closing |
Open |
Range |
Volume |
Tue 21 October 2025 |
51.03 (0.57%) |
50.53 |
49.99 - 51.40 |
0.3307 times |
Tue 30 September 2025 |
50.74 (2.3%) |
49.21 |
49.14 - 50.90 |
0.6295 times |
Fri 29 August 2025 |
49.60 (2.44%) |
47.89 |
47.89 - 49.91 |
0.6437 times |
Thu 31 July 2025 |
48.42 (0.52%) |
48.10 |
47.98 - 49.27 |
0.5373 times |
Mon 30 June 2025 |
48.17 (3.24%) |
46.52 |
46.31 - 48.23 |
0.8383 times |
Fri 30 May 2025 |
46.66 (3.57%) |
45.08 |
44.88 - 47.01 |
1.4074 times |
Wed 30 April 2025 |
45.05 (-1.59%) |
45.75 |
40.01 - 46.07 |
1.4688 times |
Mon 31 March 2025 |
45.78 (-4.21%) |
47.92 |
44.77 - 48.04 |
0.8166 times |
Fri 28 February 2025 |
47.79 (0.74%) |
46.80 |
46.74 - 48.20 |
1.1648 times |
Fri 31 January 2025 |
47.44 (3.45%) |
46.06 |
45.01 - 47.83 |
2.163 times |
Tue 31 December 2024 |
45.86 (-4.56%) |
47.77 |
45.62 - 47.77 |
0.9349 times |
DMA SMA EMA moving averages of Invesco Dividend PFM
DMA (daily moving average) of Invesco Dividend PFM
| DMA period | DMA value | | 5 day DMA | 50.85 | | 12 day DMA | 50.82 | | 20 day DMA | 50.77 | | 35 day DMA | 50.59 | | 50 day DMA | 50.25 | | 100 day DMA | 49.16 | | 150 day DMA | 47.7 | | 200 day DMA | 47.51 | EMA (exponential moving average) of Invesco Dividend PFM
| EMA period | EMA current | EMA prev | EMA prev2 | | 5 day EMA | 50.88 | 50.81 | 50.69 | | 12 day EMA | 50.81 | 50.77 | 50.72 | | 20 day EMA | 50.72 | 50.69 | 50.65 | | 35 day EMA | 50.46 | 50.43 | 50.39 | | 50 day EMA | 50.19 | 50.16 | 50.12 |
SMA (simple moving average) of Invesco Dividend PFM
| SMA period | SMA current | SMA prev | SMA prev2 | | 5 day SMA | 50.85 | 50.81 | 50.71 | | 12 day SMA | 50.82 | 50.83 | 50.82 | | 20 day SMA | 50.77 | 50.75 | 50.73 | | 35 day SMA | 50.59 | 50.54 | 50.5 | | 50 day SMA | 50.25 | 50.21 | 50.16 | | 100 day SMA | 49.16 | 49.11 | 49.07 | | 150 day SMA | 47.7 | 47.67 | 47.63 | | 200 day SMA | 47.51 | 47.48 | 47.46 |
|
|
