InvescoDwa PFI full analysis,charts,indicators,moving averages,SMA,DMA,EMA,ADX,MACD,RSIInvesco Dwa PFI WideScreen charts, DMA,SMA,EMA technical analysis, forecast prediction, by indicators ADX,MACD,RSI,CCI USA stock exchange
operates under N A sector & deals in N A
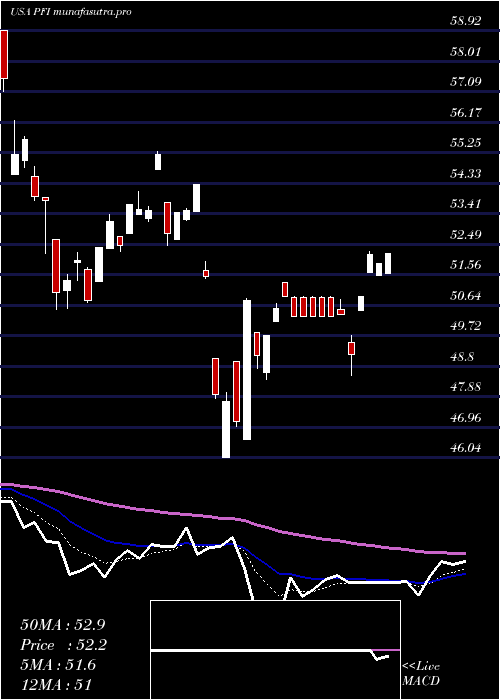
Daily price and charts and targets InvescoDwa Strong Daily Stock price targets for InvescoDwa PFI are 57.83 and 58.37 | Daily Target 1 | 57.39 | | Daily Target 2 | 57.73 | | Daily Target 3 | 57.93 | | Daily Target 4 | 58.27 | | Daily Target 5 | 58.47 |
Daily price and volume Invesco Dwa
| Date |
Closing |
Open |
Range |
Volume |
Thu 04 December 2025 |
58.07 (0.75%) |
57.59 |
57.59 - 58.13 |
1.037 times |
Wed 03 December 2025 |
57.64 (2.13%) |
57.11 |
56.96 - 57.64 |
1.8519 times |
Tue 02 December 2025 |
56.44 (0.04%) |
56.65 |
56.44 - 56.91 |
0.963 times |
Mon 01 December 2025 |
56.42 (-1.09%) |
56.42 |
56.42 - 56.42 |
0.1481 times |
Fri 28 November 2025 |
57.04 (0.8%) |
56.89 |
56.89 - 57.04 |
0.6667 times |
Wed 26 November 2025 |
56.59 (1.14%) |
56.42 |
56.41 - 56.99 |
1.8519 times |
Tue 25 November 2025 |
55.95 (2.02%) |
54.97 |
54.97 - 55.95 |
0.6667 times |
Mon 24 November 2025 |
54.84 (1.29%) |
54.30 |
54.30 - 54.84 |
0.6667 times |
Fri 21 November 2025 |
54.14 (2.07%) |
53.26 |
53.26 - 54.36 |
1.6296 times |
Thu 20 November 2025 |
53.04 (-2.18%) |
55.33 |
53.04 - 55.33 |
0.5185 times |
Wed 19 November 2025 |
54.22 (0.99%) |
53.81 |
53.81 - 54.22 |
0.6667 times |
Weekly price and charts InvescoDwa Strong weekly Stock price targets for InvescoDwa PFI are 57.25 and 58.96 | Weekly Target 1 | 55.83 | | Weekly Target 2 | 56.95 | | Weekly Target 3 | 57.54 | | Weekly Target 4 | 58.66 | | Weekly Target 5 | 59.25 |
Weekly price and volumes for Invesco Dwa
| Date |
Closing |
Open |
Range |
Volume |
Thu 04 December 2025 |
58.07 (1.81%) |
56.42 |
56.42 - 58.13 |
0.4737 times |
Fri 28 November 2025 |
57.04 (5.36%) |
54.30 |
54.30 - 57.04 |
0.4561 times |
Fri 21 November 2025 |
54.14 (-2.2%) |
54.86 |
53.04 - 55.33 |
4.0263 times |
Fri 14 November 2025 |
55.36 (-1.77%) |
56.61 |
55.22 - 57.75 |
0.5175 times |
Fri 07 November 2025 |
56.36 (-0.23%) |
56.05 |
55.52 - 57.00 |
0.9386 times |
Fri 31 October 2025 |
56.49 (0%) |
56.00 |
56.00 - 56.49 |
0.307 times |
Fri 31 October 2025 |
56.49 (-2.4%) |
58.36 |
56.00 - 58.36 |
0.9386 times |
Fri 24 October 2025 |
57.88 (4.53%) |
56.46 |
55.90 - 58.00 |
0.5702 times |
Fri 17 October 2025 |
55.37 (1.1%) |
55.39 |
55.02 - 57.10 |
0.6754 times |
Fri 10 October 2025 |
54.77 (-4.73%) |
57.66 |
54.77 - 57.66 |
1.0965 times |
Fri 03 October 2025 |
57.49 (-0.43%) |
57.68 |
56.76 - 58.20 |
1.0442 times |
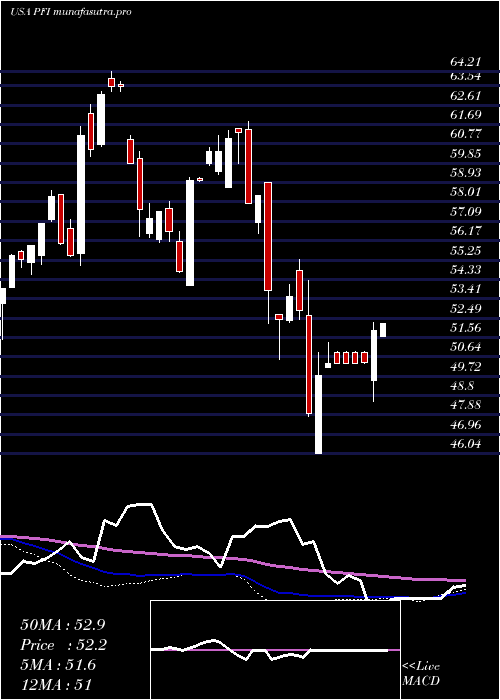
Monthly price and charts InvescoDwa Strong monthly Stock price targets for InvescoDwa PFI are 57.25 and 58.96 | Monthly Target 1 | 55.83 | | Monthly Target 2 | 56.95 | | Monthly Target 3 | 57.54 | | Monthly Target 4 | 58.66 | | Monthly Target 5 | 59.25 |
Monthly price and volumes Invesco Dwa
| Date |
Closing |
Open |
Range |
Volume |
Thu 04 December 2025 |
58.07 (1.81%) |
56.42 |
56.42 - 58.13 |
0.0684 times |
Fri 28 November 2025 |
57.04 (0.97%) |
56.05 |
53.04 - 57.75 |
0.8573 times |
Fri 31 October 2025 |
56.49 (-2.55%) |
57.49 |
54.77 - 58.36 |
0.5775 times |
Tue 30 September 2025 |
57.97 (1.45%) |
56.39 |
55.86 - 59.11 |
0.9713 times |
Fri 29 August 2025 |
57.14 (2.27%) |
54.14 |
54.14 - 57.48 |
0.5293 times |
Thu 31 July 2025 |
55.87 (-1.52%) |
56.47 |
54.86 - 57.05 |
0.6367 times |
Mon 30 June 2025 |
56.73 (2.51%) |
55.02 |
54.24 - 56.73 |
0.6154 times |
Fri 30 May 2025 |
55.34 (6.08%) |
52.63 |
52.28 - 56.34 |
1.3132 times |
Wed 30 April 2025 |
52.17 (-2.39%) |
53.24 |
46.04 - 54.28 |
1.0166 times |
Mon 31 March 2025 |
53.45 (-8.38%) |
58.92 |
50.52 - 58.92 |
3.4143 times |
Fri 28 February 2025 |
58.34 (-3.44%) |
58.69 |
56.49 - 61.83 |
1.3929 times |

DMA SMA EMA moving averages of Invesco Dwa PFI
DMA (daily moving average) of Invesco Dwa PFI
| DMA period | DMA value | | 5 day DMA | 57.12 | | 12 day DMA | 55.67 | | 20 day DMA | 55.85 | | 35 day DMA | 56.21 | | 50 day DMA | 56.45 | | 100 day DMA | 56.56 | | 150 day DMA | 56.11 | | 200 day DMA | 55.31 | EMA (exponential moving average) of Invesco Dwa PFI
| EMA period | EMA current | EMA prev | EMA prev2 | | 5 day EMA | 57.16 | 56.7 | 56.23 | | 12 day EMA | 56.4 | 56.1 | 55.82 | | 20 day EMA | 56.22 | 56.03 | 55.86 | | 35 day EMA | 56.31 | 56.21 | 56.13 | | 50 day EMA | 56.67 | 56.61 | 56.57 |
SMA (simple moving average) of Invesco Dwa PFI
| SMA period | SMA current | SMA prev | SMA prev2 | | 5 day SMA | 57.12 | 56.83 | 56.49 | | 12 day SMA | 55.67 | 55.31 | 55.12 | | 20 day SMA | 55.85 | 55.79 | 55.73 | | 35 day SMA | 56.21 | 56.18 | 56.16 | | 50 day SMA | 56.45 | 56.45 | 56.46 | | 100 day SMA | 56.56 | 56.53 | 56.51 | | 150 day SMA | 56.11 | 56.07 | 56.04 | | 200 day SMA | 55.31 | 55.32 | 55.34 |
|
|
