PrincipalFinancial PFG full analysis,charts,indicators,moving averages,SMA,DMA,EMA,ADX,MACD,RSIPrincipal Financial PFG WideScreen charts, DMA,SMA,EMA technical analysis, forecast prediction, by indicators ADX,MACD,RSI,CCI USA stock exchange
operates under Finance sector & deals in Accident Health Insurance
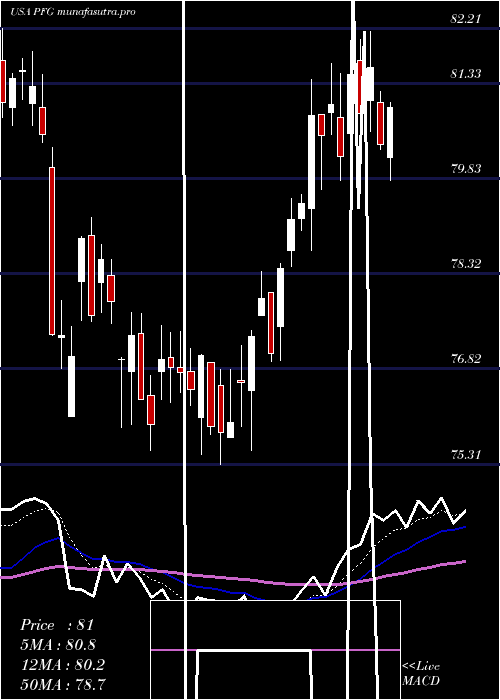
Daily price and charts and targets PrincipalFinancial Strong Daily Stock price targets for PrincipalFinancial PFG are 79.17 and 80.2 | Daily Target 1 | 78.4 | | Daily Target 2 | 78.9 | | Daily Target 3 | 79.433333333333 | | Daily Target 4 | 79.93 | | Daily Target 5 | 80.46 |
Daily price and volume Principal Financial
| Date |
Closing |
Open |
Range |
Volume |
Tue 21 October 2025 |
79.39 (0.53%) |
79.01 |
78.94 - 79.97 |
1.0364 times |
Mon 20 October 2025 |
78.97 (0.43%) |
78.78 |
78.49 - 79.32 |
0.8162 times |
Fri 17 October 2025 |
78.63 (0.31%) |
78.51 |
77.90 - 79.15 |
1.0134 times |
Thu 16 October 2025 |
78.39 (-3.1%) |
80.56 |
78.28 - 80.58 |
1.5262 times |
Wed 15 October 2025 |
80.90 (-0.48%) |
81.53 |
80.03 - 82.07 |
1.3739 times |
Tue 14 October 2025 |
81.29 (2.03%) |
78.89 |
78.50 - 81.91 |
0.7414 times |
Mon 13 October 2025 |
79.67 (0.31%) |
79.85 |
79.22 - 80.54 |
0.7159 times |
Fri 10 October 2025 |
79.42 (-3.95%) |
83.28 |
79.36 - 83.72 |
0.9174 times |
Thu 09 October 2025 |
82.69 (1.13%) |
82.17 |
81.36 - 82.83 |
0.7841 times |
Wed 08 October 2025 |
81.77 (-2.15%) |
83.64 |
81.42 - 83.81 |
1.075 times |
Tue 07 October 2025 |
83.57 (-0.72%) |
84.52 |
83.36 - 85.14 |
0.6503 times |
Weekly price and charts PrincipalFinancial Strong weekly Stock price targets for PrincipalFinancial PFG are 78.94 and 80.42 | Weekly Target 1 | 77.8 | | Weekly Target 2 | 78.6 | | Weekly Target 3 | 79.283333333333 | | Weekly Target 4 | 80.08 | | Weekly Target 5 | 80.76 |
Weekly price and volumes for Principal Financial
| Date |
Closing |
Open |
Range |
Volume |
Tue 21 October 2025 |
79.39 (0.97%) |
78.78 |
78.49 - 79.97 |
0.4354 times |
Fri 17 October 2025 |
78.63 (-0.99%) |
79.85 |
77.90 - 82.07 |
1.2624 times |
Fri 10 October 2025 |
79.42 (-5.72%) |
84.25 |
79.36 - 85.14 |
0.9177 times |
Fri 03 October 2025 |
84.24 (1.96%) |
82.84 |
81.18 - 85.00 |
1.2061 times |
Fri 26 September 2025 |
82.62 (1.11%) |
81.23 |
80.71 - 83.40 |
0.9958 times |
Fri 19 September 2025 |
81.71 (-1.2%) |
82.84 |
79.74 - 83.64 |
1.7404 times |
Fri 12 September 2025 |
82.70 (3.4%) |
79.91 |
78.11 - 82.93 |
1.1971 times |
Fri 05 September 2025 |
79.98 (-0.66%) |
79.56 |
78.63 - 82.00 |
1.0874 times |
Fri 29 August 2025 |
80.51 (0%) |
80.30 |
80.20 - 80.97 |
0.2027 times |
Fri 29 August 2025 |
80.51 (-0.26%) |
80.50 |
79.38 - 81.37 |
0.9551 times |
Fri 22 August 2025 |
80.72 (3.97%) |
77.44 |
77.15 - 81.45 |
1.1224 times |
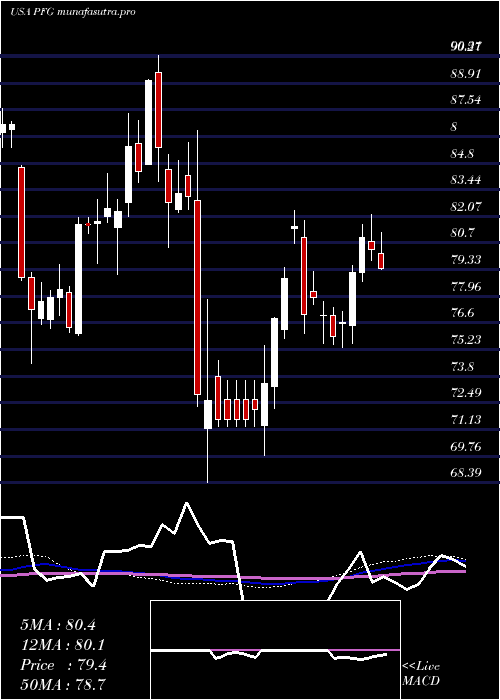
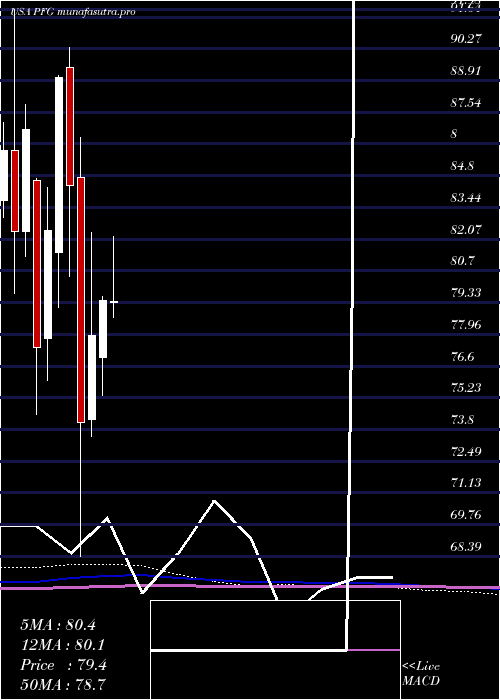
Monthly price and charts PrincipalFinancial Strong monthly Stock price targets for PrincipalFinancial PFG are 75.03 and 82.27 | Monthly Target 1 | 73.57 | | Monthly Target 2 | 76.48 | | Monthly Target 3 | 80.81 | | Monthly Target 4 | 83.72 | | Monthly Target 5 | 88.05 |
Monthly price and volumes Principal Financial
| Date |
Closing |
Open |
Range |
Volume |
Tue 21 October 2025 |
79.39 (-4.25%) |
82.72 |
77.90 - 85.14 |
0.5967 times |
Tue 30 September 2025 |
82.91 (2.98%) |
79.56 |
78.11 - 83.64 |
0.9872 times |
Fri 29 August 2025 |
80.51 (3.44%) |
76.88 |
75.00 - 81.45 |
0.8991 times |
Thu 31 July 2025 |
77.83 (-2.01%) |
79.35 |
75.88 - 83.64 |
1.0197 times |
Mon 30 June 2025 |
79.43 (1.98%) |
76.97 |
75.31 - 79.58 |
0.8085 times |
Fri 30 May 2025 |
77.89 (5.04%) |
74.30 |
73.57 - 82.36 |
0.9175 times |
Wed 30 April 2025 |
74.15 (-12.11%) |
84.72 |
68.39 - 86.46 |
1.4684 times |
Mon 31 March 2025 |
84.37 (-5.24%) |
89.47 |
80.45 - 90.31 |
1.0315 times |
Fri 28 February 2025 |
89.04 (7.99%) |
81.47 |
79.10 - 89.10 |
1.2122 times |
Fri 31 January 2025 |
82.45 (6.51%) |
77.76 |
75.97 - 84.28 |
1.0592 times |
Tue 31 December 2024 |
77.41 (-10.81%) |
84.59 |
74.52 - 84.68 |
0.6715 times |
DMA SMA EMA moving averages of Principal Financial PFG
DMA (daily moving average) of Principal Financial PFG
| DMA period | DMA value | | 5 day DMA | 79.26 | | 12 day DMA | 80.74 | | 20 day DMA | 81.59 | | 35 day DMA | 81.42 | | 50 day DMA | 80.82 | | 100 day DMA | 79.62 | | 150 day DMA | 78.82 | | 200 day DMA | 79.87 | EMA (exponential moving average) of Principal Financial PFG
| EMA period | EMA current | EMA prev | EMA prev2 | | 5 day EMA | 79.42 | 79.43 | 79.66 | | 12 day EMA | 80.33 | 80.5 | 80.78 | | 20 day EMA | 80.77 | 80.92 | 81.13 | | 35 day EMA | 80.7 | 80.78 | 80.89 | | 50 day EMA | 80.3 | 80.34 | 80.4 |
SMA (simple moving average) of Principal Financial PFG
| SMA period | SMA current | SMA prev | SMA prev2 | | 5 day SMA | 79.26 | 79.64 | 79.78 | | 12 day SMA | 80.74 | 81.14 | 81.58 | | 20 day SMA | 81.59 | 81.74 | 81.9 | | 35 day SMA | 81.42 | 81.44 | 81.48 | | 50 day SMA | 80.82 | 80.78 | 80.73 | | 100 day SMA | 79.62 | 79.6 | 79.6 | | 150 day SMA | 78.82 | 78.85 | 78.88 | | 200 day SMA | 79.87 | 79.87 | 79.86 |
|
|
