PfizerInc PFE full analysis,charts,indicators,moving averages,SMA,DMA,EMA,ADX,MACD,RSIPfizer Inc PFE WideScreen charts, DMA,SMA,EMA technical analysis, forecast prediction, by indicators ADX,MACD,RSI,CCI USA stock exchange
operates under Health Care sector & deals in Major Pharmaceuticals
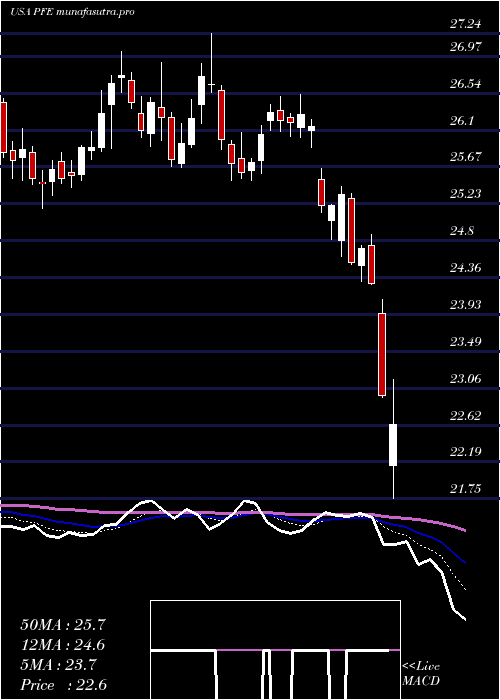
Daily price and charts and targets PfizerInc Strong Daily Stock price targets for PfizerInc PFE are 25.53 and 25.92 | Daily Target 1 | 25.21 | | Daily Target 2 | 25.45 | | Daily Target 3 | 25.596666666667 | | Daily Target 4 | 25.84 | | Daily Target 5 | 25.99 |
Daily price and volume Pfizer Inc
| Date |
Closing |
Open |
Range |
Volume |
Thu 04 December 2025 |
25.70 (0.51%) |
25.57 |
25.35 - 25.74 |
0.6514 times |
Wed 03 December 2025 |
25.57 (1.63%) |
25.32 |
25.30 - 25.89 |
1.3586 times |
Tue 02 December 2025 |
25.16 (-0.44%) |
25.33 |
25.04 - 25.42 |
0.852 times |
Mon 01 December 2025 |
25.27 (-1.83%) |
25.76 |
25.23 - 25.94 |
1.2874 times |
Fri 28 November 2025 |
25.74 (0.16%) |
25.85 |
25.66 - 25.86 |
0.5478 times |
Wed 26 November 2025 |
25.70 (-0.04%) |
25.71 |
25.58 - 25.81 |
0.5973 times |
Tue 25 November 2025 |
25.71 (1.9%) |
25.20 |
25.15 - 25.97 |
0.7384 times |
Mon 24 November 2025 |
25.23 (0.76%) |
25.15 |
25.03 - 25.47 |
0.9416 times |
Fri 21 November 2025 |
25.04 (2.62%) |
24.59 |
24.59 - 25.52 |
1.767 times |
Thu 20 November 2025 |
24.40 (-1.93%) |
24.89 |
24.28 - 25.00 |
1.2584 times |
Wed 19 November 2025 |
24.88 (-2.24%) |
25.35 |
24.72 - 25.50 |
1.5009 times |
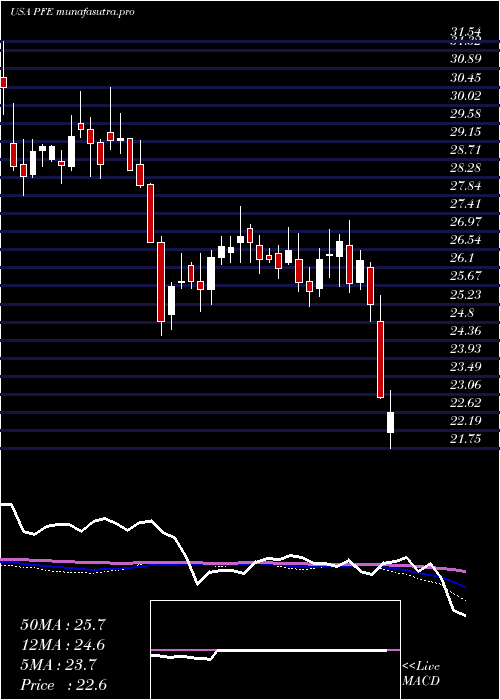
Weekly price and charts PfizerInc Strong weekly Stock price targets for PfizerInc PFE are 24.92 and 25.82 | Weekly Target 1 | 24.66 | | Weekly Target 2 | 25.18 | | Weekly Target 3 | 25.56 | | Weekly Target 4 | 26.08 | | Weekly Target 5 | 26.46 |
Weekly price and volumes for Pfizer Inc
| Date |
Closing |
Open |
Range |
Volume |
Thu 04 December 2025 |
25.70 (-0.16%) |
25.76 |
25.04 - 25.94 |
0.6311 times |
Fri 28 November 2025 |
25.74 (2.8%) |
25.15 |
25.03 - 25.97 |
0.4297 times |
Fri 21 November 2025 |
25.04 (-0.08%) |
25.11 |
24.28 - 25.57 |
1.2125 times |
Fri 14 November 2025 |
25.06 (2.54%) |
24.66 |
23.91 - 26.48 |
2.1087 times |
Fri 07 November 2025 |
24.44 (-0.85%) |
24.68 |
24.11 - 25.31 |
1.749 times |
Fri 31 October 2025 |
24.65 (0%) |
24.28 |
24.16 - 24.73 |
0.4886 times |
Fri 31 October 2025 |
24.65 (-0.52%) |
24.74 |
24.15 - 24.80 |
1.6225 times |
Fri 24 October 2025 |
24.78 (1.1%) |
24.53 |
24.46 - 25.00 |
0.5767 times |
Fri 17 October 2025 |
24.51 (-6.7%) |
24.84 |
24.16 - 24.95 |
0.8093 times |
Tue 07 October 2025 |
26.27 (-3.91%) |
27.36 |
26.05 - 27.88 |
0.372 times |
Fri 03 October 2025 |
27.34 (15.07%) |
23.79 |
23.64 - 27.69 |
1.784 times |
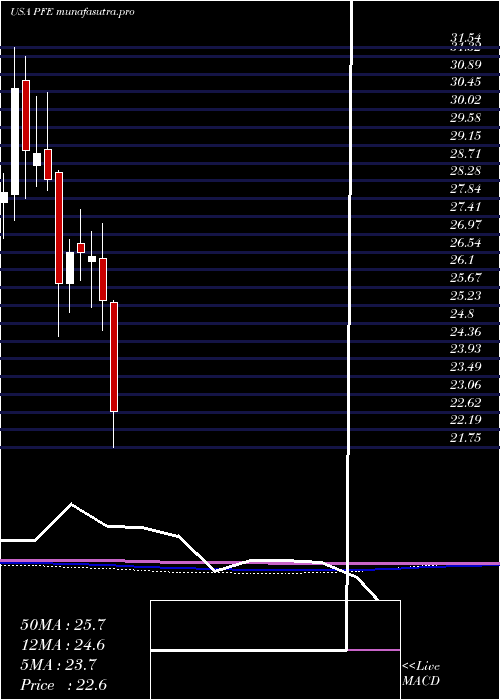
Monthly price and charts PfizerInc Strong monthly Stock price targets for PfizerInc PFE are 24.92 and 25.82 | Monthly Target 1 | 24.66 | | Monthly Target 2 | 25.18 | | Monthly Target 3 | 25.56 | | Monthly Target 4 | 26.08 | | Monthly Target 5 | 26.46 |
Monthly price and volumes Pfizer Inc
| Date |
Closing |
Open |
Range |
Volume |
Thu 04 December 2025 |
25.70 (-0.16%) |
25.76 |
25.04 - 25.94 |
0.1755 times |
Fri 28 November 2025 |
25.74 (4.42%) |
24.68 |
23.91 - 26.48 |
1.5293 times |
Fri 31 October 2025 |
24.65 (-3.26%) |
25.97 |
24.15 - 27.88 |
1.3631 times |
Tue 30 September 2025 |
25.48 (2.91%) |
24.73 |
23.58 - 25.63 |
1.1266 times |
Fri 29 August 2025 |
24.76 (6.31%) |
23.30 |
23.11 - 26.11 |
0.9123 times |
Thu 31 July 2025 |
23.29 (-3.92%) |
24.27 |
23.14 - 26.05 |
0.9041 times |
Mon 30 June 2025 |
24.24 (3.19%) |
23.54 |
23.06 - 24.95 |
0.7307 times |
Fri 30 May 2025 |
23.49 (-3.77%) |
24.30 |
21.97 - 24.33 |
0.9752 times |
Wed 30 April 2025 |
24.41 (-3.67%) |
25.29 |
20.92 - 25.35 |
1.1447 times |
Mon 31 March 2025 |
25.34 (-4.12%) |
26.37 |
24.61 - 27.24 |
1.1387 times |
Fri 28 February 2025 |
26.43 (-0.34%) |
26.30 |
25.17 - 27.03 |
0.8078 times |
DMA SMA EMA moving averages of Pfizer Inc PFE
DMA (daily moving average) of Pfizer Inc PFE
| DMA period | DMA value | | 5 day DMA | 25.49 | | 12 day DMA | 25.32 | | 20 day DMA | 25.24 | | 35 day DMA | 24.96 | | 50 day DMA | 25.01 | | 100 day DMA | 24.84 | | 150 day DMA | 24.5 | | 200 day DMA | 24.54 | EMA (exponential moving average) of Pfizer Inc PFE
| EMA period | EMA current | EMA prev | EMA prev2 | | 5 day EMA | 25.51 | 25.42 | 25.35 | | 12 day EMA | 25.38 | 25.32 | 25.28 | | 20 day EMA | 25.25 | 25.2 | 25.16 | | 35 day EMA | 25.12 | 25.09 | 25.06 | | 50 day EMA | 24.97 | 24.94 | 24.91 |
SMA (simple moving average) of Pfizer Inc PFE
| SMA period | SMA current | SMA prev | SMA prev2 | | 5 day SMA | 25.49 | 25.49 | 25.52 | | 12 day SMA | 25.32 | 25.27 | 25.23 | | 20 day SMA | 25.24 | 25.19 | 25.13 | | 35 day SMA | 24.96 | 24.92 | 24.89 | | 50 day SMA | 25.01 | 24.97 | 24.95 | | 100 day SMA | 24.84 | 24.84 | 24.84 | | 150 day SMA | 24.5 | 24.48 | 24.47 | | 200 day SMA | 24.54 | 24.54 | 24.54 |
|
|
