PreferredBank PFBC full analysis,charts,indicators,moving averages,SMA,DMA,EMA,ADX,MACD,RSIPreferred Bank PFBC WideScreen charts, DMA,SMA,EMA technical analysis, forecast prediction, by indicators ADX,MACD,RSI,CCI USA stock exchange
operates under N A sector & deals in N A
Daily price and charts and targets PreferredBank Strong Daily Stock price targets for PreferredBank PFBC are 94.37 and 95.46 | Daily Target 1 | 94.09 | | Daily Target 2 | 94.65 | | Daily Target 3 | 95.176666666667 | | Daily Target 4 | 95.74 | | Daily Target 5 | 96.27 |
Daily price and volume Preferred Bank
| Date |
Closing |
Open |
Range |
Volume |
Thu 04 December 2025 |
95.22 (-0.19%) |
95.40 |
94.61 - 95.70 |
0.6899 times |
Wed 03 December 2025 |
95.40 (0.91%) |
95.00 |
94.34 - 96.12 |
0.9666 times |
Tue 02 December 2025 |
94.54 (-1.47%) |
96.40 |
94.17 - 97.15 |
0.6267 times |
Mon 01 December 2025 |
95.95 (1.63%) |
93.71 |
92.42 - 96.26 |
1.5858 times |
Fri 28 November 2025 |
94.41 (-0.5%) |
94.60 |
94.35 - 95.16 |
0.4309 times |
Wed 26 November 2025 |
94.88 (-0.3%) |
94.71 |
93.97 - 96.00 |
1.4253 times |
Tue 25 November 2025 |
95.17 (2.84%) |
93.02 |
93.02 - 95.32 |
1.1132 times |
Mon 24 November 2025 |
92.54 (-0.39%) |
93.10 |
91.70 - 94.03 |
0.6937 times |
Fri 21 November 2025 |
92.90 (2.43%) |
90.72 |
90.66 - 94.05 |
1.4683 times |
Thu 20 November 2025 |
90.70 (-0.03%) |
91.11 |
90.46 - 92.23 |
0.9995 times |
Wed 19 November 2025 |
90.73 (0.9%) |
90.52 |
89.60 - 91.13 |
0.6697 times |
Weekly price and charts PreferredBank Strong weekly Stock price targets for PreferredBank PFBC are 93.82 and 98.55 | Weekly Target 1 | 90.2 | | Weekly Target 2 | 92.71 | | Weekly Target 3 | 94.93 | | Weekly Target 4 | 97.44 | | Weekly Target 5 | 99.66 |
Weekly price and volumes for Preferred Bank
| Date |
Closing |
Open |
Range |
Volume |
Thu 04 December 2025 |
95.22 (0.86%) |
93.71 |
92.42 - 97.15 |
0.9413 times |
Fri 28 November 2025 |
94.41 (1.63%) |
93.10 |
91.70 - 96.00 |
0.8912 times |
Fri 21 November 2025 |
92.90 (1.82%) |
91.34 |
88.89 - 94.05 |
1.1759 times |
Fri 14 November 2025 |
91.24 (-0.37%) |
92.18 |
90.71 - 93.21 |
0.8304 times |
Fri 07 November 2025 |
91.58 (1.47%) |
90.70 |
90.05 - 92.16 |
0.8503 times |
Fri 31 October 2025 |
90.25 (0%) |
90.11 |
89.60 - 90.98 |
0.237 times |
Fri 31 October 2025 |
90.25 (-3.05%) |
93.20 |
88.05 - 93.94 |
1.1227 times |
Fri 24 October 2025 |
93.09 (9.12%) |
86.39 |
85.54 - 94.05 |
1.3954 times |
Fri 17 October 2025 |
85.31 (-1.93%) |
87.87 |
83.75 - 91.19 |
1.3671 times |
Fri 10 October 2025 |
86.99 (-3.38%) |
90.66 |
86.77 - 92.62 |
1.1885 times |
Fri 03 October 2025 |
90.03 (-1.49%) |
91.52 |
89.07 - 92.61 |
0.9154 times |
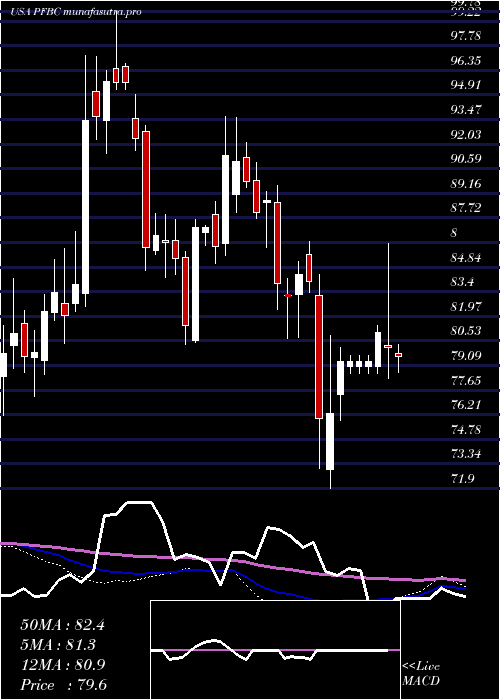
Monthly price and charts PreferredBank Strong monthly Stock price targets for PreferredBank PFBC are 93.82 and 98.55 | Monthly Target 1 | 90.2 | | Monthly Target 2 | 92.71 | | Monthly Target 3 | 94.93 | | Monthly Target 4 | 97.44 | | Monthly Target 5 | 99.66 |
Monthly price and volumes Preferred Bank
| Date |
Closing |
Open |
Range |
Volume |
Thu 04 December 2025 |
95.22 (0.86%) |
93.71 |
92.42 - 97.15 |
0.1743 times |
Fri 28 November 2025 |
94.41 (4.61%) |
90.70 |
88.89 - 96.00 |
0.6941 times |
Fri 31 October 2025 |
90.25 (-0.15%) |
89.84 |
83.75 - 94.05 |
1.0763 times |
Tue 30 September 2025 |
90.39 (-4.25%) |
93.45 |
89.29 - 97.25 |
0.9769 times |
Fri 29 August 2025 |
94.40 (3.94%) |
90.08 |
87.20 - 96.02 |
0.9435 times |
Thu 31 July 2025 |
90.82 (4.93%) |
86.40 |
86.40 - 99.45 |
1.0403 times |
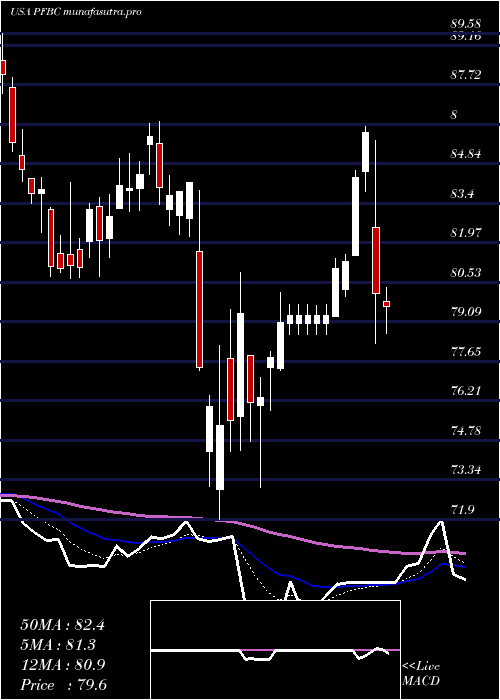
Mon 30 June 2025 |
86.55 (3.52%) |
83.54 |
79.60 - 87.91 |
1.0498 times |
Fri 30 May 2025 |
83.61 (4.7%) |
80.01 |
79.60 - 87.60 |
1.2682 times |
Wed 30 April 2025 |
79.86 (-4.54%) |
82.96 |
71.90 - 86.20 |
1.6336 times |
Mon 31 March 2025 |
83.66 (-5.74%) |
88.60 |
80.67 - 89.58 |
1.1431 times |
Fri 28 February 2025 |
88.75 (-2.86%) |
89.09 |
85.99 - 93.59 |
0.8109 times |

DMA SMA EMA moving averages of Preferred Bank PFBC
DMA (daily moving average) of Preferred Bank PFBC
| DMA period | DMA value | | 5 day DMA | 95.1 | | 12 day DMA | 93.53 | | 20 day DMA | 92.69 | | 35 day DMA | 91.69 | | 50 day DMA | 91.16 | | 100 day DMA | 92.18 | | 150 day DMA | 89.88 | | 200 day DMA | 88.02 | EMA (exponential moving average) of Preferred Bank PFBC
| EMA period | EMA current | EMA prev | EMA prev2 | | 5 day EMA | 94.96 | 94.83 | 94.55 | | 12 day EMA | 93.96 | 93.73 | 93.43 | | 20 day EMA | 93.19 | 92.98 | 92.73 | | 35 day EMA | 92.36 | 92.19 | 92 | | 50 day EMA | 91.7 | 91.56 | 91.4 |
SMA (simple moving average) of Preferred Bank PFBC
| SMA period | SMA current | SMA prev | SMA prev2 | | 5 day SMA | 95.1 | 95.04 | 94.99 | | 12 day SMA | 93.53 | 93.07 | 92.72 | | 20 day SMA | 92.69 | 92.49 | 92.27 | | 35 day SMA | 91.69 | 91.51 | 91.37 | | 50 day SMA | 91.16 | 91.09 | 91.02 | | 100 day SMA | 92.18 | 92.13 | 92.11 | | 150 day SMA | 89.88 | 89.77 | 89.68 | | 200 day SMA | 88.02 | 87.99 | 87.96 |
|
|
