TdhHoldings PETZ full analysis,charts,indicators,moving averages,SMA,DMA,EMA,ADX,MACD,RSITdh Holdings PETZ WideScreen charts, DMA,SMA,EMA technical analysis, forecast prediction, by indicators ADX,MACD,RSI,CCI USA stock exchange
operates under Consumer Non Durables sector & deals in Packaged Foods
Daily price and charts and targets TdhHoldings Strong Daily Stock price targets for TdhHoldings PETZ are 1.02 and 1.08 | Daily Target 1 | 0.97 | | Daily Target 2 | 1.01 | | Daily Target 3 | 1.0333333333333 | | Daily Target 4 | 1.07 | | Daily Target 5 | 1.09 |
Daily price and volume Tdh Holdings
| Date |
Closing |
Open |
Range |
Volume |
Thu 04 December 2025 |
1.04 (0.97%) |
1.02 |
1.00 - 1.06 |
1.9461 times |
Wed 03 December 2025 |
1.03 (-2.83%) |
1.06 |
1.03 - 1.08 |
1.481 times |
Tue 02 December 2025 |
1.06 (2.91%) |
1.01 |
1.01 - 1.06 |
1.1506 times |
Mon 01 December 2025 |
1.03 (4.04%) |
1.02 |
1.02 - 1.03 |
0.0857 times |
Fri 28 November 2025 |
0.99 (-1%) |
1.00 |
0.99 - 1.00 |
1.0037 times |
Wed 26 November 2025 |
1.00 (4.17%) |
0.96 |
0.96 - 1.00 |
0.6487 times |
Tue 25 November 2025 |
0.96 (1.05%) |
0.97 |
0.95 - 0.97 |
0.5018 times |
Mon 24 November 2025 |
0.95 (-2.06%) |
0.97 |
0.95 - 0.97 |
0.7711 times |
Fri 21 November 2025 |
0.97 (-1.02%) |
1.04 |
0.97 - 1.04 |
0.967 times |
Thu 20 November 2025 |
0.98 (-2%) |
1.02 |
0.98 - 1.02 |
1.4443 times |
Wed 19 November 2025 |
1.00 (0%) |
1.04 |
1.00 - 1.04 |
1.1873 times |
Weekly price and charts TdhHoldings Strong weekly Stock price targets for TdhHoldings PETZ are 1.02 and 1.1 | Weekly Target 1 | 0.96 | | Weekly Target 2 | 1 | | Weekly Target 3 | 1.04 | | Weekly Target 4 | 1.08 | | Weekly Target 5 | 1.12 |
Weekly price and volumes for Tdh Holdings
| Date |
Closing |
Open |
Range |
Volume |
Thu 04 December 2025 |
1.04 (5.05%) |
1.02 |
1.00 - 1.08 |
0.8969 times |
Fri 28 November 2025 |
0.99 (2.06%) |
0.97 |
0.95 - 1.00 |
0.5626 times |
Fri 21 November 2025 |
0.97 (-4.9%) |
1.04 |
0.97 - 1.06 |
1.064 times |
Fri 14 November 2025 |
1.02 (-0.97%) |
1.06 |
1.00 - 1.07 |
0.6591 times |
Fri 07 November 2025 |
1.03 (-4.63%) |
1.04 |
1.03 - 1.11 |
0.8498 times |
Fri 31 October 2025 |
1.08 (0%) |
1.04 |
1.04 - 1.08 |
0.0942 times |
Fri 31 October 2025 |
1.08 (1.89%) |
1.11 |
1.03 - 1.13 |
1.1158 times |
Fri 24 October 2025 |
1.06 (1.92%) |
1.01 |
1.01 - 1.12 |
0.6215 times |
Fri 17 October 2025 |
1.04 (-4.59%) |
1.10 |
1.01 - 1.13 |
1.9068 times |
Fri 10 October 2025 |
1.09 (-5.22%) |
1.13 |
1.05 - 1.18 |
2.2293 times |
Fri 03 October 2025 |
1.15 (5.5%) |
1.08 |
1.05 - 1.19 |
2.2633 times |

Monthly price and charts TdhHoldings Strong monthly Stock price targets for TdhHoldings PETZ are 1.02 and 1.1 | Monthly Target 1 | 0.96 | | Monthly Target 2 | 1 | | Monthly Target 3 | 1.04 | | Monthly Target 4 | 1.08 | | Monthly Target 5 | 1.12 |
Monthly price and volumes Tdh Holdings
| Date |
Closing |
Open |
Range |
Volume |
Thu 04 December 2025 |
1.04 (5.05%) |
1.02 |
1.00 - 1.08 |
0.0463 times |
Fri 28 November 2025 |
0.99 (-8.33%) |
1.04 |
0.95 - 1.11 |
0.1619 times |
Fri 31 October 2025 |
1.08 (0.93%) |
1.12 |
1.01 - 1.19 |
0.4094 times |
Tue 30 September 2025 |
1.07 (3.88%) |
1.03 |
0.96 - 1.68 |
8.117 times |
Thu 28 August 2025 |
1.03 (-0.96%) |
1.00 |
0.95 - 1.10 |
0.1314 times |
Thu 31 July 2025 |
1.04 (6.12%) |
0.98 |
0.94 - 1.22 |
0.2675 times |
Mon 30 June 2025 |
0.98 (3.16%) |
1.02 |
0.90 - 1.15 |
0.2118 times |
Fri 30 May 2025 |
0.95 (-9.52%) |
1.07 |
0.65 - 1.08 |
0.3025 times |
Wed 30 April 2025 |
1.05 (-8.7%) |
1.15 |
0.99 - 1.20 |
0.1637 times |
Mon 31 March 2025 |
1.15 (-7.26%) |
1.18 |
1.15 - 1.41 |
0.1885 times |
Fri 28 February 2025 |
1.24 (4.2%) |
1.16 |
1.13 - 1.40 |
0.2755 times |

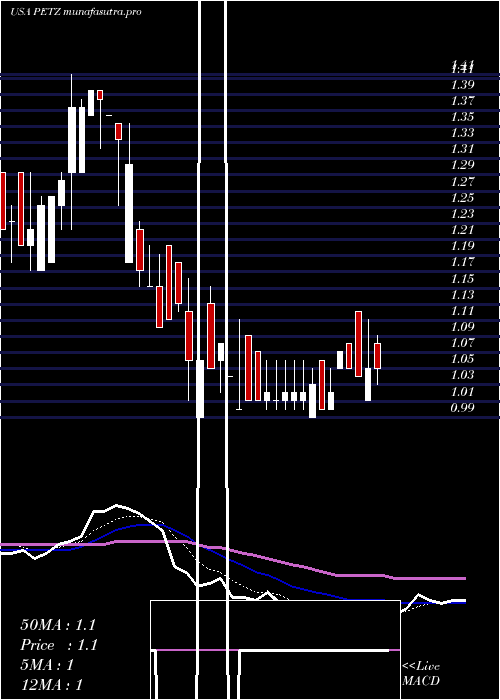
DMA SMA EMA moving averages of Tdh Holdings PETZ
DMA (daily moving average) of Tdh Holdings PETZ
| DMA period | DMA value | | 5 day DMA | 1.03 | | 12 day DMA | 1 | | 20 day DMA | 1.01 | | 35 day DMA | 1.03 | | 50 day DMA | 1.05 | | 100 day DMA | 1.05 | | 150 day DMA | 1.03 | | 200 day DMA | 1.06 | EMA (exponential moving average) of Tdh Holdings PETZ
| EMA period | EMA current | EMA prev | EMA prev2 | | 5 day EMA | 1.03 | 1.02 | 1.02 | | 12 day EMA | 1.01 | 1.01 | 1.01 | | 20 day EMA | 1.01 | 1.01 | 1.01 | | 35 day EMA | 1.04 | 1.04 | 1.04 | | 50 day EMA | 1.06 | 1.06 | 1.06 |
SMA (simple moving average) of Tdh Holdings PETZ
| SMA period | SMA current | SMA prev | SMA prev2 | | 5 day SMA | 1.03 | 1.02 | 1.01 | | 12 day SMA | 1 | 1 | 1 | | 20 day SMA | 1.01 | 1.01 | 1.01 | | 35 day SMA | 1.03 | 1.03 | 1.03 | | 50 day SMA | 1.05 | 1.05 | 1.06 | | 100 day SMA | 1.05 | 1.05 | 1.05 | | 150 day SMA | 1.03 | 1.03 | 1.03 | | 200 day SMA | 1.06 | 1.07 | 1.07 |
|
|
