PepsicoInc PEP full analysis,charts,indicators,moving averages,SMA,DMA,EMA,ADX,MACD,RSIPepsico Inc PEP WideScreen charts, DMA,SMA,EMA technical analysis, forecast prediction, by indicators ADX,MACD,RSI,CCI USA stock exchange
operates under Consumer Non Durables sector & deals in Beverages Production Distribution
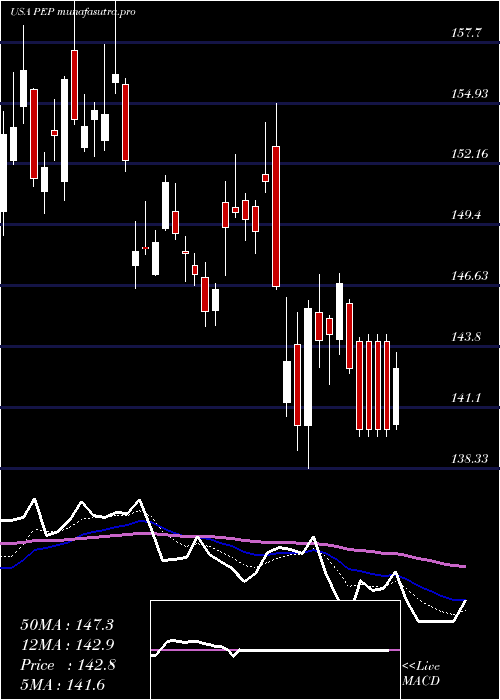
Daily price and charts and targets PepsicoInc Strong Daily Stock price targets for PepsicoInc PEP are 145.17 and 147.87 | Daily Target 1 | 144.59 | | Daily Target 2 | 145.75 | | Daily Target 3 | 147.29 | | Daily Target 4 | 148.45 | | Daily Target 5 | 149.99 |
Daily price and volume Pepsico Inc
| Date |
Closing |
Open |
Range |
Volume |
Thu 04 December 2025 |
146.91 (-0.78%) |
148.81 |
146.13 - 148.83 |
0.5233 times |
Wed 03 December 2025 |
148.06 (-0.37%) |
148.69 |
147.91 - 150.70 |
0.8528 times |
Tue 02 December 2025 |
148.61 (-0.6%) |
149.26 |
146.53 - 149.85 |
0.4604 times |
Mon 01 December 2025 |
149.51 (0.52%) |
148.63 |
148.51 - 149.82 |
1.2724 times |
Fri 28 November 2025 |
148.74 (0.51%) |
147.23 |
147.23 - 148.82 |
0.4956 times |
Wed 26 November 2025 |
147.98 (1.28%) |
146.32 |
146.23 - 148.47 |
0.8647 times |
Tue 25 November 2025 |
146.11 (0.42%) |
145.93 |
145.57 - 147.12 |
1.4945 times |
Mon 24 November 2025 |
145.50 (-0.57%) |
145.83 |
144.76 - 146.34 |
1.5675 times |
Fri 21 November 2025 |
146.33 (0.16%) |
146.28 |
145.98 - 148.93 |
1.3206 times |
Thu 20 November 2025 |
146.10 (-0.69%) |
146.60 |
144.90 - 147.08 |
1.1482 times |
Wed 19 November 2025 |
147.11 (-1.12%) |
148.30 |
146.69 - 148.80 |
1.3559 times |
Weekly price and charts PepsicoInc Strong weekly Stock price targets for PepsicoInc PEP are 144.24 and 148.81 | Weekly Target 1 | 143.34 | | Weekly Target 2 | 145.13 | | Weekly Target 3 | 147.91333333333 | | Weekly Target 4 | 149.7 | | Weekly Target 5 | 152.48 |
Weekly price and volumes for Pepsico Inc
| Date |
Closing |
Open |
Range |
Volume |
Thu 04 December 2025 |
146.91 (-1.23%) |
148.63 |
146.13 - 150.70 |
0.6845 times |
Fri 28 November 2025 |
148.74 (1.65%) |
145.83 |
144.76 - 148.82 |
0.9737 times |
Fri 21 November 2025 |
146.33 (0.33%) |
146.12 |
144.90 - 149.83 |
1.5087 times |
Fri 14 November 2025 |
145.85 (2.02%) |
142.49 |
141.26 - 146.84 |
1.0431 times |
Fri 07 November 2025 |
142.96 (-2.14%) |
144.70 |
141.30 - 144.93 |
0.5678 times |
Fri 31 October 2025 |
146.09 (0%) |
146.20 |
145.30 - 147.00 |
0.232 times |
Fri 31 October 2025 |
146.09 (-3.61%) |
151.01 |
143.67 - 153.21 |
1.11 times |
Fri 24 October 2025 |
151.56 (-1.4%) |
153.74 |
151.03 - 155.19 |
0.6704 times |
Fri 17 October 2025 |
153.71 (2.42%) |
148.65 |
147.34 - 154.38 |
1.3592 times |
Fri 10 October 2025 |
150.08 (5.5%) |
141.95 |
138.59 - 150.82 |
1.8506 times |
Fri 03 October 2025 |
142.26 (1.3%) |
140.44 |
139.12 - 143.37 |
1.2035 times |

Monthly price and charts PepsicoInc Strong monthly Stock price targets for PepsicoInc PEP are 144.24 and 148.81 | Monthly Target 1 | 143.34 | | Monthly Target 2 | 145.13 | | Monthly Target 3 | 147.91333333333 | | Monthly Target 4 | 149.7 | | Monthly Target 5 | 152.48 |
Monthly price and volumes Pepsico Inc
| Date |
Closing |
Open |
Range |
Volume |
Thu 04 December 2025 |
146.91 (-1.23%) |
148.63 |
146.13 - 150.70 |
0.1213 times |
Fri 28 November 2025 |
148.74 (1.81%) |
144.70 |
141.26 - 149.83 |
0.7253 times |
Fri 31 October 2025 |
146.09 (4.02%) |
140.81 |
138.59 - 155.19 |
1.0116 times |
Tue 30 September 2025 |
140.44 (-5.52%) |
157.44 |
139.12 - 157.80 |
1.1009 times |
Fri 29 August 2025 |
148.65 (7.78%) |
139.10 |
138.29 - 154.61 |
1.0494 times |
Thu 31 July 2025 |
137.92 (4.45%) |
132.59 |
132.47 - 147.03 |
1.3644 times |
Mon 30 June 2025 |
132.04 (0.45%) |
130.90 |
127.60 - 133.06 |
1.3854 times |
Fri 30 May 2025 |
131.45 (-3.05%) |
134.47 |
127.75 - 134.81 |
1.1557 times |
Wed 30 April 2025 |
135.58 (-9.58%) |
150.49 |
131.52 - 154.92 |
1.1747 times |
Mon 31 March 2025 |
149.94 (-2.3%) |
151.35 |
144.75 - 160.15 |
0.9113 times |
Fri 28 February 2025 |
153.47 (1.84%) |
149.76 |
141.60 - 158.46 |
0.9603 times |
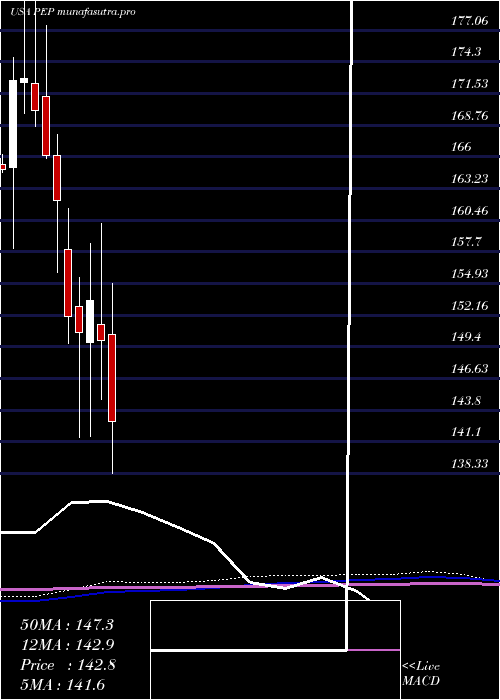
DMA SMA EMA moving averages of Pepsico Inc PEP
DMA (daily moving average) of Pepsico Inc PEP
| DMA period | DMA value | | 5 day DMA | 148.37 | | 12 day DMA | 147.48 | | 20 day DMA | 146.25 | | 35 day DMA | 147.68 | | 50 day DMA | 146.47 | | 100 day DMA | 145.59 | | 150 day DMA | 140.96 | | 200 day DMA | 142.41 | EMA (exponential moving average) of Pepsico Inc PEP
| EMA period | EMA current | EMA prev | EMA prev2 | | 5 day EMA | 147.78 | 148.21 | 148.28 | | 12 day EMA | 147.42 | 147.51 | 147.41 | | 20 day EMA | 147.05 | 147.07 | 146.97 | | 35 day EMA | 146.48 | 146.45 | 146.36 | | 50 day EMA | 146.25 | 146.22 | 146.14 |
SMA (simple moving average) of Pepsico Inc PEP
| SMA period | SMA current | SMA prev | SMA prev2 | | 5 day SMA | 148.37 | 148.58 | 148.19 | | 12 day SMA | 147.48 | 147.55 | 147.37 | | 20 day SMA | 146.25 | 146.05 | 145.79 | | 35 day SMA | 147.68 | 147.8 | 147.9 | | 50 day SMA | 146.47 | 146.37 | 146.25 | | 100 day SMA | 145.59 | 145.46 | 145.33 | | 150 day SMA | 140.96 | 140.89 | 140.8 | | 200 day SMA | 142.41 | 142.39 | 142.38 |
|
|
