PegasystemsInc PEGA full analysis,charts,indicators,moving averages,SMA,DMA,EMA,ADX,MACD,RSIPegasystems Inc PEGA WideScreen charts, DMA,SMA,EMA technical analysis, forecast prediction, by indicators ADX,MACD,RSI,CCI USA stock exchange
operates under Technology sector & deals in EDP Services
Daily price and charts and targets PegasystemsInc Strong Daily Stock price targets for PegasystemsInc PEGA are 55.57 and 59.14 | Daily Target 1 | 52.7 | | Daily Target 2 | 54.87 | | Daily Target 3 | 56.266666666667 | | Daily Target 4 | 58.44 | | Daily Target 5 | 59.84 |
Daily price and volume Pegasystems Inc
| Date |
Closing |
Open |
Range |
Volume |
Tue 21 October 2025 |
57.05 (4.22%) |
54.60 |
54.09 - 57.66 |
2.3629 times |
Mon 20 October 2025 |
54.74 (2.55%) |
53.98 |
53.73 - 55.02 |
0.6226 times |
Fri 17 October 2025 |
53.38 (-2.22%) |
54.48 |
53.29 - 55.39 |
1.1452 times |
Thu 16 October 2025 |
54.59 (-1.18%) |
55.73 |
54.25 - 56.47 |
0.7515 times |
Wed 15 October 2025 |
55.24 (-1.06%) |
56.67 |
54.71 - 56.67 |
0.8027 times |
Tue 14 October 2025 |
55.83 (1.77%) |
54.00 |
53.68 - 56.16 |
1.1785 times |
Mon 13 October 2025 |
54.86 (2.12%) |
54.77 |
54.25 - 55.03 |
0.6859 times |
Fri 10 October 2025 |
53.72 (-4.46%) |
56.29 |
53.48 - 56.83 |
0.7635 times |
Thu 09 October 2025 |
56.23 (0.05%) |
56.09 |
55.12 - 56.25 |
0.7154 times |
Wed 08 October 2025 |
56.20 (2.09%) |
55.58 |
54.98 - 56.34 |
0.9718 times |
Tue 07 October 2025 |
55.05 (-1.2%) |
55.64 |
54.02 - 55.78 |
0.892 times |
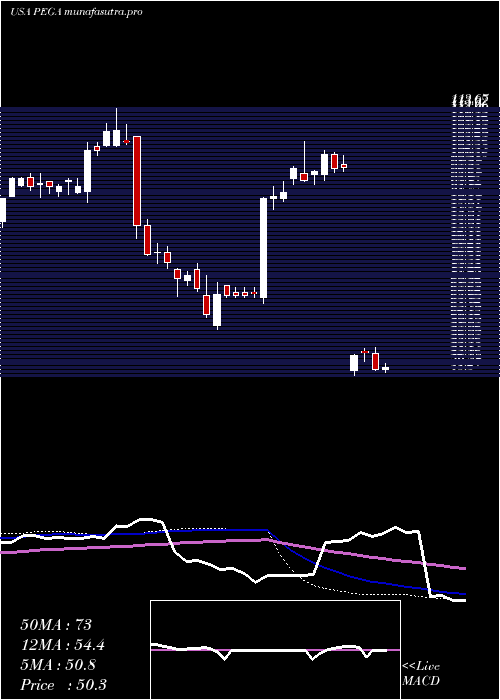
Weekly price and charts PegasystemsInc Strong weekly Stock price targets for PegasystemsInc PEGA are 55.39 and 59.32 | Weekly Target 1 | 52.22 | | Weekly Target 2 | 54.63 | | Weekly Target 3 | 56.146666666667 | | Weekly Target 4 | 58.56 | | Weekly Target 5 | 60.08 |
Weekly price and volumes for Pegasystems Inc
| Date |
Closing |
Open |
Range |
Volume |
Tue 21 October 2025 |
57.05 (6.88%) |
53.98 |
53.73 - 57.66 |
0.6744 times |
Fri 17 October 2025 |
53.38 (-0.63%) |
54.77 |
53.29 - 56.67 |
1.0309 times |
Fri 10 October 2025 |
53.72 (-3.14%) |
55.52 |
53.48 - 56.83 |
1.0374 times |
Fri 03 October 2025 |
55.46 (-5.46%) |
59.21 |
55.40 - 59.53 |
1.0217 times |
Fri 26 September 2025 |
58.66 (-1.71%) |
59.37 |
57.68 - 61.00 |
0.9357 times |
Fri 19 September 2025 |
59.68 (2.77%) |
58.26 |
57.68 - 60.46 |
2.0182 times |
Fri 12 September 2025 |
58.07 (4.61%) |
55.87 |
55.78 - 58.85 |
1.2733 times |
Fri 05 September 2025 |
55.51 (2.4%) |
52.95 |
52.26 - 55.54 |
0.8606 times |
Fri 29 August 2025 |
54.21 (0%) |
53.74 |
53.36 - 54.25 |
0.1837 times |
Fri 29 August 2025 |
54.21 (2.42%) |
52.61 |
52.18 - 54.25 |
0.9642 times |
Fri 22 August 2025 |
52.93 (0.51%) |
52.61 |
50.39 - 53.75 |
0.9896 times |
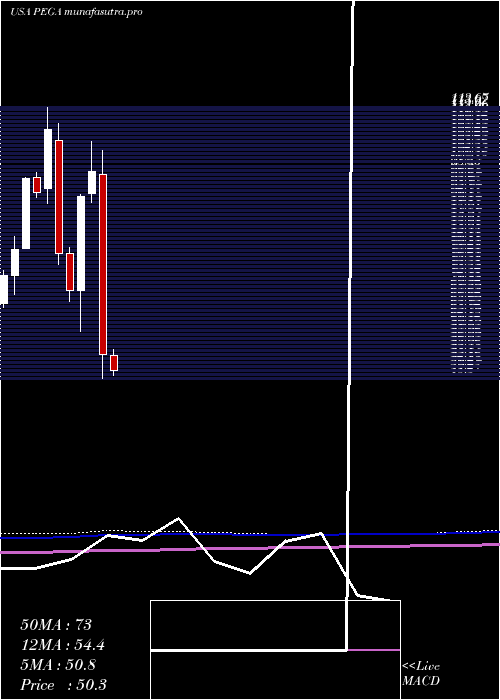
Monthly price and charts PegasystemsInc Strong monthly Stock price targets for PegasystemsInc PEGA are 52.66 and 57.69 | Monthly Target 1 | 51.19 | | Monthly Target 2 | 54.12 | | Monthly Target 3 | 56.22 | | Monthly Target 4 | 59.15 | | Monthly Target 5 | 61.25 |
Monthly price and volumes Pegasystems Inc
| Date |
Closing |
Open |
Range |
Volume |
Tue 21 October 2025 |
57.05 (-0.78%) |
57.37 |
53.29 - 58.32 |
0.7168 times |
Tue 30 September 2025 |
57.50 (6.07%) |
52.95 |
52.26 - 61.00 |
1.1533 times |
Fri 29 August 2025 |
54.21 (-7.66%) |
58.00 |
49.32 - 58.88 |
1.1665 times |
Thu 31 July 2025 |
58.71 (8.46%) |
53.82 |
49.16 - 60.96 |
1.797 times |
Mon 30 June 2025 |
54.13 (-44.85%) |
97.48 |
48.30 - 103.30 |
0.9384 times |
Fri 30 May 2025 |
98.15 (6.59%) |
93.00 |
90.82 - 105.50 |
1.0417 times |
Wed 30 April 2025 |
92.08 (32.45%) |
69.49 |
59.67 - 92.66 |
0.8487 times |
Mon 31 March 2025 |
69.52 (-11.45%) |
78.45 |
67.03 - 79.84 |
0.6793 times |
Fri 28 February 2025 |
78.51 (-27.5%) |
105.63 |
75.72 - 109.78 |
0.8739 times |
Fri 31 January 2025 |
108.29 (16.19%) |
94.00 |
90.56 - 113.67 |
0.7845 times |
Tue 31 December 2024 |
93.20 (-3.37%) |
96.81 |
91.89 - 97.85 |
0.2372 times |
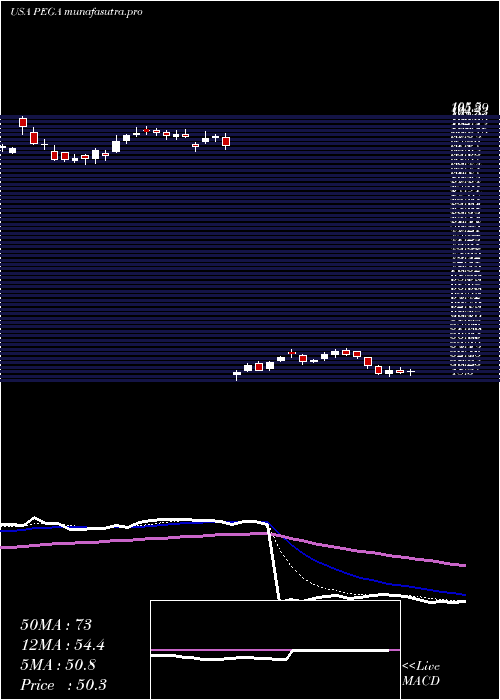
DMA SMA EMA moving averages of Pegasystems Inc PEGA
DMA (daily moving average) of Pegasystems Inc PEGA
| DMA period | DMA value | | 5 day DMA | 55 | | 12 day DMA | 55.22 | | 20 day DMA | 56.29 | | 35 day DMA | 56.9 | | 50 day DMA | 55.69 | | 100 day DMA | 61.7 | | 150 day DMA | 68.34 | | 200 day DMA | 74.33 | EMA (exponential moving average) of Pegasystems Inc PEGA
| EMA period | EMA current | EMA prev | EMA prev2 | | 5 day EMA | 55.42 | 54.6 | 54.53 | | 12 day EMA | 55.54 | 55.26 | 55.36 | | 20 day EMA | 55.87 | 55.75 | 55.86 | | 35 day EMA | 55.59 | 55.5 | 55.54 | | 50 day EMA | 55.38 | 55.31 | 55.33 |
SMA (simple moving average) of Pegasystems Inc PEGA
| SMA period | SMA current | SMA prev | SMA prev2 | | 5 day SMA | 55 | 54.76 | 54.78 | | 12 day SMA | 55.22 | 55.09 | 55.32 | | 20 day SMA | 56.29 | 56.46 | 56.72 | | 35 day SMA | 56.9 | 56.81 | 56.79 | | 50 day SMA | 55.69 | 55.56 | 55.46 | | 100 day SMA | 61.7 | 62.09 | 62.5 | | 150 day SMA | 68.34 | 68.44 | 68.53 | | 200 day SMA | 74.33 | 74.51 | 74.7 |
|
|
