PeoplesBancorp PEBO full analysis,charts,indicators,moving averages,SMA,DMA,EMA,ADX,MACD,RSIPeoples Bancorp PEBO WideScreen charts, DMA,SMA,EMA technical analysis, forecast prediction, by indicators ADX,MACD,RSI,CCI USA stock exchange
operates under Finance sector & deals in Major Banks
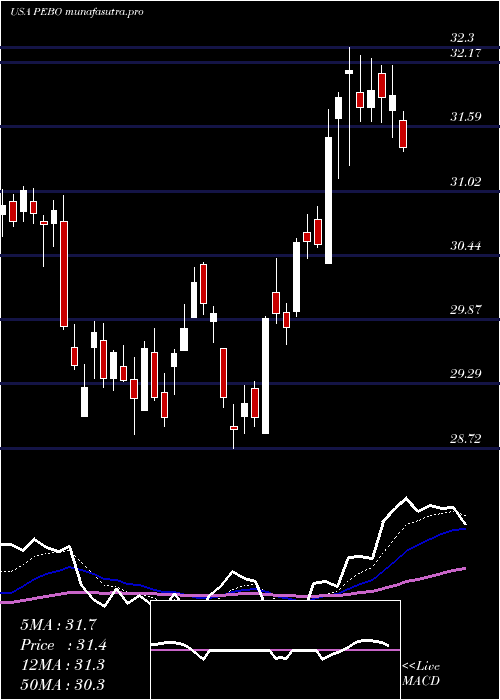
Daily price and charts and targets PeoplesBancorp Strong Daily Stock price targets for PeoplesBancorp PEBO are 30.31 and 30.65 | Daily Target 1 | 30.06 | | Daily Target 2 | 30.21 | | Daily Target 3 | 30.403333333333 | | Daily Target 4 | 30.55 | | Daily Target 5 | 30.74 |
Daily price and volume Peoples Bancorp
| Date |
Closing |
Open |
Range |
Volume |
Thu 04 December 2025 |
30.35 (-0.16%) |
30.26 |
30.26 - 30.60 |
0.7708 times |
Wed 03 December 2025 |
30.40 (2.01%) |
29.80 |
29.76 - 30.50 |
1.083 times |
Tue 02 December 2025 |
29.80 (-0.17%) |
29.97 |
29.73 - 30.07 |
0.903 times |
Mon 01 December 2025 |
29.85 (0.74%) |
29.43 |
29.43 - 29.98 |
0.8977 times |
Fri 28 November 2025 |
29.63 (-0.54%) |
29.87 |
29.50 - 29.88 |
0.5066 times |
Wed 26 November 2025 |
29.79 (-0.5%) |
29.92 |
29.67 - 29.95 |
0.8688 times |
Tue 25 November 2025 |
29.94 (2.92%) |
29.25 |
29.25 - 30.12 |
1.2804 times |
Mon 24 November 2025 |
29.09 (-1.09%) |
29.35 |
29.02 - 29.35 |
1.2569 times |
Fri 21 November 2025 |
29.41 (3.16%) |
28.60 |
28.50 - 29.67 |
1.308 times |
Thu 20 November 2025 |
28.51 (0.14%) |
28.73 |
28.35 - 28.98 |
1.1248 times |
Wed 19 November 2025 |
28.47 (0.57%) |
28.31 |
28.23 - 28.56 |
1.1369 times |
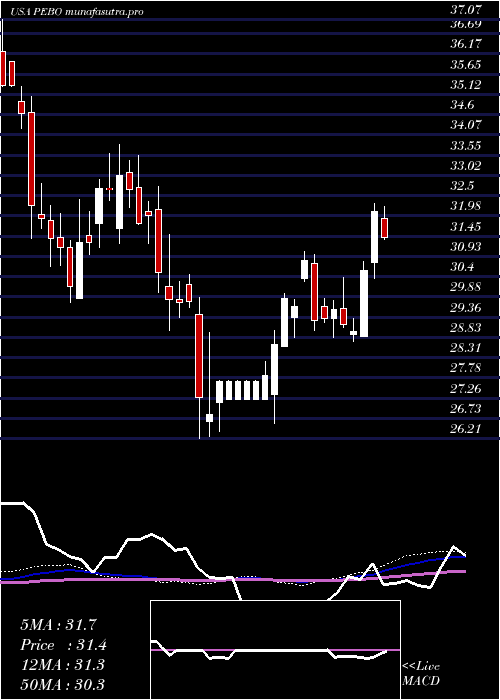
Weekly price and charts PeoplesBancorp Strong weekly Stock price targets for PeoplesBancorp PEBO are 29.89 and 31.06 | Weekly Target 1 | 28.96 | | Weekly Target 2 | 29.65 | | Weekly Target 3 | 30.126666666667 | | Weekly Target 4 | 30.82 | | Weekly Target 5 | 31.3 |
Weekly price and volumes for Peoples Bancorp
| Date |
Closing |
Open |
Range |
Volume |
Thu 04 December 2025 |
30.35 (2.43%) |
29.43 |
29.43 - 30.60 |
0.6664 times |
Fri 28 November 2025 |
29.63 (0.75%) |
29.35 |
29.02 - 30.12 |
0.7135 times |
Fri 21 November 2025 |
29.41 (1.2%) |
29.08 |
28.23 - 29.67 |
1.1402 times |
Fri 14 November 2025 |
29.06 (0.38%) |
29.05 |
28.51 - 29.66 |
1.3807 times |
Fri 07 November 2025 |
28.95 (1.22%) |
28.35 |
28.01 - 28.95 |
0.8916 times |
Fri 31 October 2025 |
28.60 (0%) |
28.56 |
28.40 - 28.86 |
0.2047 times |
Fri 31 October 2025 |
28.60 (-5.01%) |
30.25 |
28.40 - 30.25 |
1.1431 times |
Fri 24 October 2025 |
30.11 (6.96%) |
28.25 |
28.08 - 30.23 |
1.5505 times |
Fri 17 October 2025 |
28.15 (-1.71%) |
29.09 |
27.49 - 29.99 |
1.3188 times |
Fri 10 October 2025 |
28.64 (-4.31%) |
30.19 |
28.61 - 30.61 |
0.9904 times |
Fri 03 October 2025 |
29.93 (-1.61%) |
30.47 |
29.47 - 30.47 |
0.7169 times |
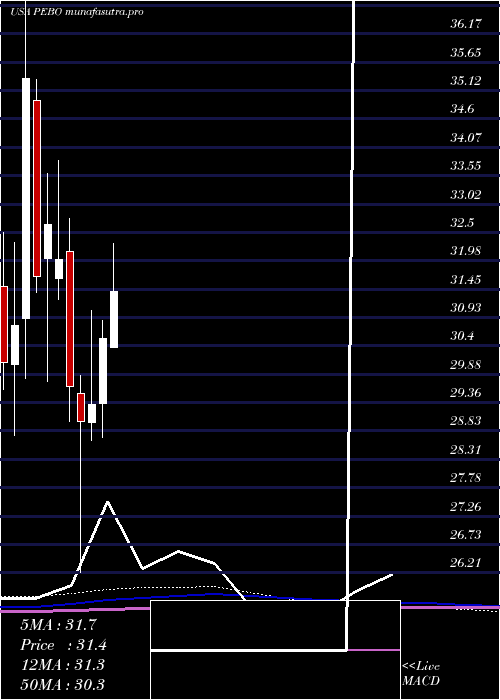
Monthly price and charts PeoplesBancorp Strong monthly Stock price targets for PeoplesBancorp PEBO are 29.89 and 31.06 | Monthly Target 1 | 28.96 | | Monthly Target 2 | 29.65 | | Monthly Target 3 | 30.126666666667 | | Monthly Target 4 | 30.82 | | Monthly Target 5 | 31.3 |
Monthly price and volumes Peoples Bancorp
| Date |
Closing |
Open |
Range |
Volume |
Thu 04 December 2025 |
30.35 (2.43%) |
29.43 |
29.43 - 30.60 |
0.1624 times |
Fri 28 November 2025 |
29.63 (3.6%) |
28.35 |
28.01 - 30.12 |
1.0052 times |
Fri 31 October 2025 |
28.60 (-4.63%) |
29.78 |
27.49 - 30.61 |
1.375 times |
Tue 30 September 2025 |
29.99 (-3.07%) |
30.68 |
29.59 - 31.55 |
0.8783 times |
Fri 29 August 2025 |
30.94 (8.03%) |
28.47 |
27.83 - 31.49 |
1.0972 times |
Thu 31 July 2025 |
28.64 (-6.22%) |
30.37 |
28.48 - 32.30 |
1.544 times |
Mon 30 June 2025 |
30.54 (4.16%) |
29.33 |
28.72 - 30.88 |
1.0386 times |
Fri 30 May 2025 |
29.32 (1.07%) |
28.98 |
28.65 - 31.06 |
0.8841 times |
Wed 30 April 2025 |
29.01 (-2.19%) |
29.53 |
26.21 - 29.86 |
1.084 times |
Mon 31 March 2025 |
29.66 (-7.31%) |
32.14 |
29.00 - 32.75 |
0.9312 times |
Fri 28 February 2025 |
32.00 (-1.99%) |
31.64 |
31.25 - 33.83 |
0.822 times |
DMA SMA EMA moving averages of Peoples Bancorp PEBO
DMA (daily moving average) of Peoples Bancorp PEBO
| DMA period | DMA value | | 5 day DMA | 30.01 | | 12 day DMA | 29.46 | | 20 day DMA | 29.25 | | 35 day DMA | 29.1 | | 50 day DMA | 29.31 | | 100 day DMA | 29.7 | | 150 day DMA | 29.86 | | 200 day DMA | 29.71 | EMA (exponential moving average) of Peoples Bancorp PEBO
| EMA period | EMA current | EMA prev | EMA prev2 | | 5 day EMA | 30.06 | 29.92 | 29.68 | | 12 day EMA | 29.67 | 29.55 | 29.39 | | 20 day EMA | 29.48 | 29.39 | 29.28 | | 35 day EMA | 29.42 | 29.37 | 29.31 | | 50 day EMA | 29.49 | 29.45 | 29.41 |
SMA (simple moving average) of Peoples Bancorp PEBO
| SMA period | SMA current | SMA prev | SMA prev2 | | 5 day SMA | 30.01 | 29.89 | 29.8 | | 12 day SMA | 29.46 | 29.3 | 29.19 | | 20 day SMA | 29.25 | 29.17 | 29.08 | | 35 day SMA | 29.1 | 29.07 | 29.05 | | 50 day SMA | 29.31 | 29.31 | 29.3 | | 100 day SMA | 29.7 | 29.71 | 29.72 | | 150 day SMA | 29.86 | 29.85 | 29.85 | | 200 day SMA | 29.71 | 29.72 | 29.74 |
|
|
