JohnHancock PDT full analysis,charts,indicators,moving averages,SMA,DMA,EMA,ADX,MACD,RSIJohn Hancock PDT WideScreen charts, DMA,SMA,EMA technical analysis, forecast prediction, by indicators ADX,MACD,RSI,CCI USA stock exchange
operates under N A sector & deals in N A
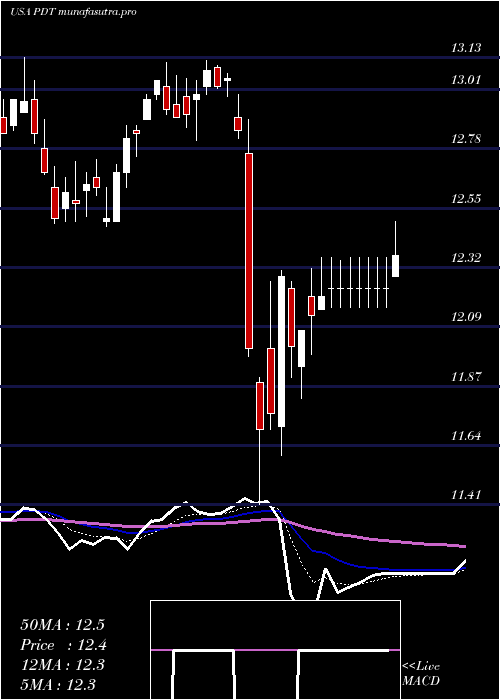
Daily price and charts and targets JohnHancock Strong Daily Stock price targets for JohnHancock PDT are 12.82 and 12.92 | Daily Target 1 | 12.74 | | Daily Target 2 | 12.79 | | Daily Target 3 | 12.84 | | Daily Target 4 | 12.89 | | Daily Target 5 | 12.94 |
Daily price and volume John Hancock
| Date |
Closing |
Open |
Range |
Volume |
Thu 04 December 2025 |
12.84 (-0.08%) |
12.81 |
12.79 - 12.89 |
0.7198 times |
Wed 03 December 2025 |
12.85 (-0.54%) |
12.84 |
12.74 - 12.90 |
1.3992 times |
Tue 02 December 2025 |
12.92 (-0.31%) |
12.97 |
12.87 - 13.03 |
0.8279 times |
Mon 01 December 2025 |
12.96 (-1.22%) |
13.10 |
12.95 - 13.10 |
1.7846 times |
Fri 28 November 2025 |
13.12 (0.15%) |
13.13 |
13.07 - 13.15 |
0.7083 times |
Wed 26 November 2025 |
13.10 (0.77%) |
13.02 |
13.02 - 13.10 |
0.8131 times |
Tue 25 November 2025 |
13.00 (0.93%) |
12.90 |
12.86 - 13.01 |
1.0333 times |
Mon 24 November 2025 |
12.88 (1.42%) |
12.80 |
12.74 - 12.88 |
0.9816 times |
Fri 21 November 2025 |
12.70 (0.47%) |
12.64 |
12.60 - 12.73 |
0.8198 times |
Thu 20 November 2025 |
12.64 (-0.78%) |
12.77 |
12.61 - 12.81 |
0.9124 times |
Wed 19 November 2025 |
12.74 (-0.93%) |
12.83 |
12.72 - 12.86 |
1.5234 times |
Weekly price and charts JohnHancock Strong weekly Stock price targets for JohnHancock PDT are 12.61 and 12.97 | Weekly Target 1 | 12.53 | | Weekly Target 2 | 12.69 | | Weekly Target 3 | 12.893333333333 | | Weekly Target 4 | 13.05 | | Weekly Target 5 | 13.25 |
Weekly price and volumes for John Hancock
| Date |
Closing |
Open |
Range |
Volume |
Thu 04 December 2025 |
12.84 (-2.13%) |
13.10 |
12.74 - 13.10 |
1.4073 times |
Fri 28 November 2025 |
13.12 (3.31%) |
12.80 |
12.74 - 13.15 |
1.0518 times |
Fri 21 November 2025 |
12.70 (-2.31%) |
12.95 |
12.60 - 13.04 |
1.5357 times |
Fri 14 November 2025 |
13.00 (0.08%) |
13.06 |
12.92 - 13.20 |
1.2397 times |
Fri 07 November 2025 |
12.99 (-0.38%) |
12.91 |
12.86 - 12.99 |
0.7355 times |
Fri 31 October 2025 |
13.04 (0%) |
12.98 |
12.97 - 13.09 |
0.2291 times |
Fri 31 October 2025 |
13.04 (-0.46%) |
13.12 |
12.96 - 13.20 |
1.2333 times |
Fri 24 October 2025 |
13.10 (0.54%) |
13.03 |
13.03 - 13.17 |
0.9348 times |
Fri 17 October 2025 |
13.03 (-2.4%) |
13.13 |
13.01 - 13.32 |
1.1832 times |
Tue 07 October 2025 |
13.35 (-0.22%) |
13.40 |
13.27 - 13.49 |
0.4496 times |
Fri 03 October 2025 |
13.38 (0.98%) |
13.27 |
13.21 - 13.48 |
1.5013 times |

Monthly price and charts JohnHancock Strong monthly Stock price targets for JohnHancock PDT are 12.61 and 12.97 | Monthly Target 1 | 12.53 | | Monthly Target 2 | 12.69 | | Monthly Target 3 | 12.893333333333 | | Monthly Target 4 | 13.05 | | Monthly Target 5 | 13.25 |
Monthly price and volumes John Hancock
| Date |
Closing |
Open |
Range |
Volume |
Thu 04 December 2025 |
12.84 (-2.13%) |
13.10 |
12.74 - 13.10 |
0.3163 times |
Fri 28 November 2025 |
13.12 (0.61%) |
12.91 |
12.60 - 13.20 |
1.0256 times |
Fri 31 October 2025 |
13.04 (-2.25%) |
13.31 |
12.96 - 13.49 |
1.1002 times |
Tue 30 September 2025 |
13.34 (-0.45%) |
13.37 |
13.18 - 13.49 |
1.0848 times |
Fri 29 August 2025 |
13.40 (0.45%) |
13.34 |
13.21 - 13.50 |
1.0749 times |
Thu 31 July 2025 |
13.34 (1.29%) |
13.17 |
13.01 - 13.40 |
1.1123 times |
Mon 30 June 2025 |
13.17 (0.08%) |
13.14 |
12.90 - 13.28 |
0.9984 times |
Fri 30 May 2025 |
13.16 (4.11%) |
12.64 |
12.42 - 13.19 |
1.1708 times |
Wed 30 April 2025 |
12.64 (-3.36%) |
13.09 |
11.41 - 13.10 |
1.1146 times |
Mon 31 March 2025 |
13.08 (0.85%) |
12.92 |
12.48 - 13.13 |
1.002 times |
Fri 28 February 2025 |
12.97 (1.25%) |
12.78 |
12.68 - 13.05 |
0.9522 times |

DMA SMA EMA moving averages of John Hancock PDT
DMA (daily moving average) of John Hancock PDT
| DMA period | DMA value | | 5 day DMA | 12.94 | | 12 day DMA | 12.88 | | 20 day DMA | 12.94 | | 35 day DMA | 12.99 | | 50 day DMA | 13.08 | | 100 day DMA | 13.21 | | 150 day DMA | 13.12 | | 200 day DMA | 12.99 | EMA (exponential moving average) of John Hancock PDT
| EMA period | EMA current | EMA prev | EMA prev2 | | 5 day EMA | 12.9 | 12.93 | 12.97 | | 12 day EMA | 12.92 | 12.93 | 12.95 | | 20 day EMA | 12.95 | 12.96 | 12.97 | | 35 day EMA | 13.01 | 13.02 | 13.03 | | 50 day EMA | 13.09 | 13.1 | 13.11 |
SMA (simple moving average) of John Hancock PDT
| SMA period | SMA current | SMA prev | SMA prev2 | | 5 day SMA | 12.94 | 12.99 | 13.02 | | 12 day SMA | 12.88 | 12.89 | 12.9 | | 20 day SMA | 12.94 | 12.94 | 12.94 | | 35 day SMA | 12.99 | 13 | 13.01 | | 50 day SMA | 13.08 | 13.09 | 13.1 | | 100 day SMA | 13.21 | 13.22 | 13.22 | | 150 day SMA | 13.12 | 13.12 | 13.12 | | 200 day SMA | 12.99 | 12.99 | 12.99 |
|
|
