PiedmontficeRealty PDM full analysis,charts,indicators,moving averages,SMA,DMA,EMA,ADX,MACD,RSIPiedmontfice Realty PDM WideScreen charts, DMA,SMA,EMA technical analysis, forecast prediction, by indicators ADX,MACD,RSI,CCI USA stock exchange
operates under Consumer Services sector & deals in Building Operators
Daily price and charts and targets PiedmontficeRealty Strong Daily Stock price targets for PiedmontficeRealty PDM are 8.3 and 8.48 | Daily Target 1 | 8.27 | | Daily Target 2 | 8.33 | | Daily Target 3 | 8.45 | | Daily Target 4 | 8.51 | | Daily Target 5 | 8.63 |
Daily price and volume Piedmontfice Realty
| Date |
Closing |
Open |
Range |
Volume |
Thu 04 December 2025 |
8.39 (-1.99%) |
8.51 |
8.39 - 8.57 |
0.9121 times |
Wed 03 December 2025 |
8.56 (-0.93%) |
8.63 |
8.43 - 8.75 |
0.8272 times |
Tue 02 December 2025 |
8.64 (-0.92%) |
8.80 |
8.64 - 8.80 |
0.6758 times |
Mon 01 December 2025 |
8.72 (-0.23%) |
8.63 |
8.52 - 8.85 |
1.0113 times |
Fri 28 November 2025 |
8.74 (-0.34%) |
8.77 |
8.70 - 8.82 |
0.4516 times |
Wed 26 November 2025 |
8.77 (3.42%) |
8.43 |
8.43 - 8.87 |
1.3744 times |
Tue 25 November 2025 |
8.48 (1.68%) |
8.37 |
8.27 - 8.62 |
1.796 times |
Mon 24 November 2025 |
8.34 (1.34%) |
8.28 |
8.15 - 8.39 |
0.9777 times |
Fri 21 November 2025 |
8.23 (2.75%) |
8.05 |
8.03 - 8.34 |
1.0092 times |
Thu 20 November 2025 |
8.01 (-0.5%) |
8.16 |
8.00 - 8.31 |
0.9646 times |
Wed 19 November 2025 |
8.05 (-1.11%) |
8.12 |
8.00 - 8.16 |
0.7335 times |
Weekly price and charts PiedmontficeRealty Strong weekly Stock price targets for PiedmontficeRealty PDM are 8.16 and 8.62 | Weekly Target 1 | 8.08 | | Weekly Target 2 | 8.24 | | Weekly Target 3 | 8.5433333333333 | | Weekly Target 4 | 8.7 | | Weekly Target 5 | 9 |
Weekly price and volumes for Piedmontfice Realty
| Date |
Closing |
Open |
Range |
Volume |
Thu 04 December 2025 |
8.39 (-4%) |
8.63 |
8.39 - 8.85 |
0.8056 times |
Fri 28 November 2025 |
8.74 (6.2%) |
8.28 |
8.15 - 8.87 |
1.0815 times |
Fri 21 November 2025 |
8.23 (-0.96%) |
8.23 |
7.88 - 8.36 |
1.0409 times |
Fri 14 November 2025 |
8.31 (0.61%) |
8.30 |
8.07 - 8.52 |
1.1423 times |
Fri 07 November 2025 |
8.26 (2.48%) |
8.10 |
7.97 - 8.32 |
0.8267 times |
Fri 31 October 2025 |
8.06 (0%) |
7.98 |
7.91 - 8.12 |
0.3644 times |
Fri 31 October 2025 |
8.06 (-4.39%) |
8.42 |
7.91 - 8.90 |
1.7529 times |
Fri 24 October 2025 |
8.43 (3.31%) |
8.17 |
8.13 - 8.50 |
1.0012 times |
Fri 17 October 2025 |
8.16 (-5.56%) |
8.07 |
7.94 - 8.40 |
1.4959 times |
Tue 07 October 2025 |
8.64 (-1.14%) |
8.76 |
8.59 - 8.78 |
0.4887 times |
Fri 03 October 2025 |
8.74 (-0.34%) |
8.78 |
8.67 - 9.03 |
1.2814 times |
Monthly price and charts PiedmontficeRealty Strong monthly Stock price targets for PiedmontficeRealty PDM are 8.16 and 8.62 | Monthly Target 1 | 8.08 | | Monthly Target 2 | 8.24 | | Monthly Target 3 | 8.5433333333333 | | Monthly Target 4 | 8.7 | | Monthly Target 5 | 9 |
Monthly price and volumes Piedmontfice Realty
| Date |
Closing |
Open |
Range |
Volume |
Thu 04 December 2025 |
8.39 (-4%) |
8.63 |
8.39 - 8.85 |
0.1416 times |
Fri 28 November 2025 |
8.74 (8.44%) |
8.10 |
7.88 - 8.87 |
0.719 times |
Fri 31 October 2025 |
8.06 (-10.44%) |
8.92 |
7.91 - 9.03 |
1.0232 times |
Tue 30 September 2025 |
9.00 (6.26%) |
8.30 |
8.30 - 9.19 |
1.0415 times |
Fri 29 August 2025 |
8.47 (12.04%) |
7.57 |
7.24 - 8.48 |
1.0442 times |
Thu 31 July 2025 |
7.56 (3.7%) |
7.21 |
7.18 - 7.86 |
1.0444 times |
Mon 30 June 2025 |
7.29 (2.39%) |
7.17 |
7.04 - 7.82 |
1.1815 times |
Fri 30 May 2025 |
7.12 (20.47%) |
5.95 |
5.93 - 7.30 |
1.5235 times |
Wed 30 April 2025 |
5.91 (-19.81%) |
7.39 |
5.46 - 7.56 |
1.5336 times |
Mon 31 March 2025 |
7.37 (-2.9%) |
7.58 |
6.87 - 7.69 |
0.7475 times |
Fri 28 February 2025 |
7.59 (-13.16%) |
8.53 |
7.01 - 8.69 |
1.0872 times |

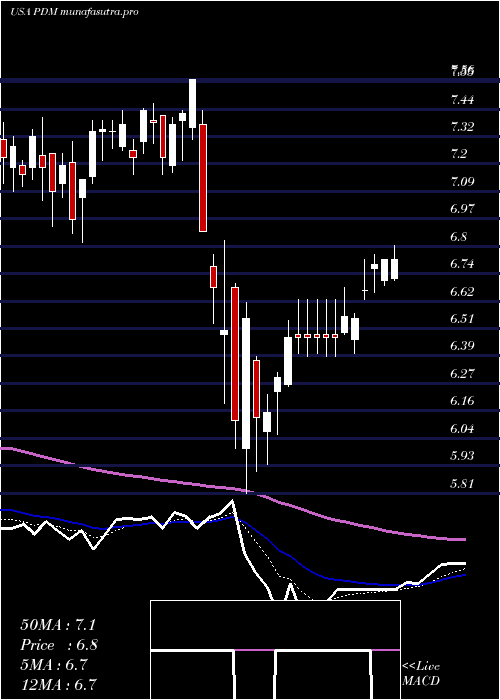
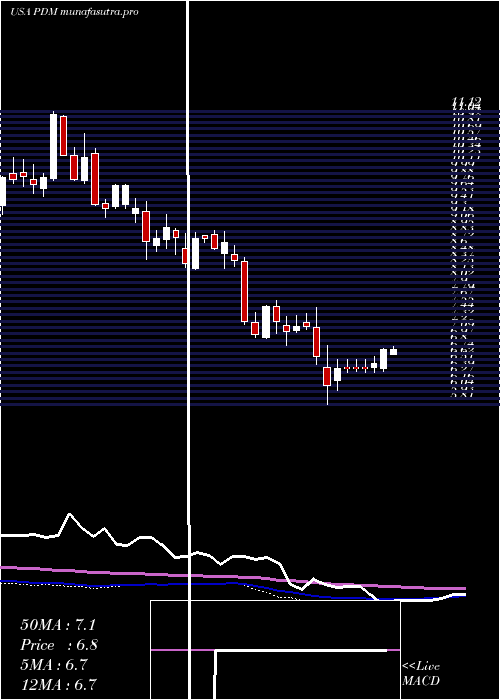
DMA SMA EMA moving averages of Piedmontfice Realty PDM
DMA (daily moving average) of Piedmontfice Realty PDM
| DMA period | DMA value | | 5 day DMA | 8.61 | | 12 day DMA | 8.42 | | 20 day DMA | 8.34 | | 35 day DMA | 8.3 | | 50 day DMA | 8.42 | | 100 day DMA | 8.22 | | 150 day DMA | 7.84 | | 200 day DMA | 7.63 | EMA (exponential moving average) of Piedmontfice Realty PDM
| EMA period | EMA current | EMA prev | EMA prev2 | | 5 day EMA | 8.53 | 8.6 | 8.62 | | 12 day EMA | 8.47 | 8.48 | 8.46 | | 20 day EMA | 8.42 | 8.42 | 8.4 | | 35 day EMA | 8.43 | 8.43 | 8.42 | | 50 day EMA | 8.48 | 8.48 | 8.48 |
SMA (simple moving average) of Piedmontfice Realty PDM
| SMA period | SMA current | SMA prev | SMA prev2 | | 5 day SMA | 8.61 | 8.69 | 8.67 | | 12 day SMA | 8.42 | 8.39 | 8.37 | | 20 day SMA | 8.34 | 8.33 | 8.31 | | 35 day SMA | 8.3 | 8.3 | 8.28 | | 50 day SMA | 8.42 | 8.43 | 8.44 | | 100 day SMA | 8.22 | 8.21 | 8.2 | | 150 day SMA | 7.84 | 7.83 | 7.82 | | 200 day SMA | 7.63 | 7.62 | 7.62 |
|
|
