ProDex PDEX full analysis,charts,indicators,moving averages,SMA,DMA,EMA,ADX,MACD,RSIPro Dex PDEX WideScreen charts, DMA,SMA,EMA technical analysis, forecast prediction, by indicators ADX,MACD,RSI,CCI USA stock exchange
operates under Health Care sector & deals in Medical Dental Instruments
Daily price and charts and targets ProDex Strong Daily Stock price targets for ProDex PDEX are 24.82 and 26.07 | Daily Target 1 | 24.55 | | Daily Target 2 | 25.09 | | Daily Target 3 | 25.796666666667 | | Daily Target 4 | 26.34 | | Daily Target 5 | 27.05 |
Daily price and volume Pro Dex
| Date |
Closing |
Open |
Range |
Volume |
Mon 20 October 2025 |
25.64 (-2.21%) |
25.92 |
25.25 - 26.50 |
0.6057 times |
Fri 17 October 2025 |
26.22 (9.66%) |
26.48 |
25.08 - 28.00 |
1.6546 times |
Thu 16 October 2025 |
23.91 (-4.82%) |
24.73 |
23.47 - 24.95 |
0.6973 times |
Wed 15 October 2025 |
25.12 (-0.91%) |
25.05 |
24.59 - 25.85 |
0.5056 times |
Tue 14 October 2025 |
25.35 (-4.41%) |
26.04 |
24.04 - 26.15 |
1.1936 times |
Mon 13 October 2025 |
26.52 (-20.43%) |
34.01 |
24.22 - 35.34 |
4.1184 times |
Fri 10 October 2025 |
33.33 (-3.81%) |
34.85 |
32.87 - 34.85 |
0.2305 times |
Thu 09 October 2025 |
34.65 (-0.26%) |
35.02 |
33.97 - 35.51 |
0.3188 times |
Wed 08 October 2025 |
34.74 (5.85%) |
32.80 |
32.17 - 35.07 |
0.4088 times |
Tue 07 October 2025 |
32.82 (-3.47%) |
33.84 |
32.70 - 34.00 |
0.2667 times |
Mon 06 October 2025 |
34.00 (-0.09%) |
34.02 |
33.35 - 34.36 |
0.0995 times |
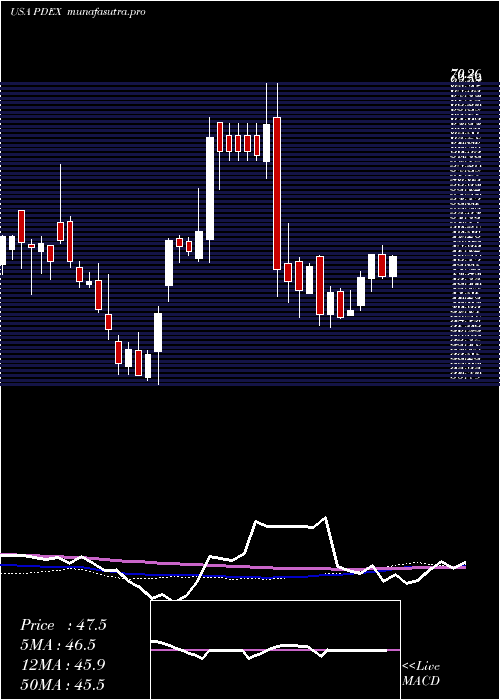
Weekly price and charts ProDex Strong weekly Stock price targets for ProDex PDEX are 24.82 and 26.07 | Weekly Target 1 | 24.55 | | Weekly Target 2 | 25.09 | | Weekly Target 3 | 25.796666666667 | | Weekly Target 4 | 26.34 | | Weekly Target 5 | 27.05 |
Weekly price and volumes for Pro Dex
| Date |
Closing |
Open |
Range |
Volume |
Mon 20 October 2025 |
25.64 (-2.21%) |
25.92 |
25.25 - 26.50 |
0.327 times |
Fri 17 October 2025 |
26.22 (-21.33%) |
34.01 |
23.47 - 35.34 |
4.411 times |
Fri 10 October 2025 |
33.33 (-2.06%) |
34.02 |
32.17 - 35.51 |
0.715 times |
Fri 03 October 2025 |
34.03 (0.12%) |
33.90 |
33.35 - 35.75 |
0.5683 times |
Fri 26 September 2025 |
33.99 (-1.08%) |
34.27 |
33.35 - 35.30 |
0.5305 times |
Fri 19 September 2025 |
34.36 (3.9%) |
33.00 |
31.72 - 35.00 |
1.0546 times |
Fri 12 September 2025 |
33.07 (-13.41%) |
38.13 |
32.92 - 38.31 |
1.2158 times |
Fri 05 September 2025 |
38.19 (-18.54%) |
46.13 |
38.02 - 47.81 |
0.6468 times |
Fri 29 August 2025 |
46.88 (0%) |
46.78 |
46.50 - 47.50 |
0.0649 times |
Fri 29 August 2025 |
46.88 (1.85%) |
46.00 |
45.50 - 47.86 |
0.466 times |
Fri 22 August 2025 |
46.03 (7.72%) |
42.43 |
42.26 - 48.45 |
0.5941 times |
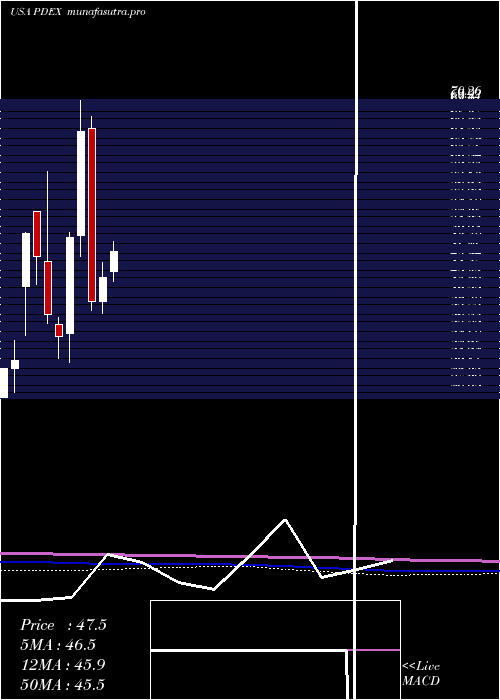
Monthly price and charts ProDex Strong monthly Stock price targets for ProDex PDEX are 18.42 and 30.7 | Monthly Target 1 | 16.01 | | Monthly Target 2 | 20.82 | | Monthly Target 3 | 28.286666666667 | | Monthly Target 4 | 33.1 | | Monthly Target 5 | 40.57 |
Monthly price and volumes Pro Dex
| Date |
Closing |
Open |
Range |
Volume |
Mon 20 October 2025 |
25.64 (-24.25%) |
33.63 |
23.47 - 35.75 |
1.3274 times |
Tue 30 September 2025 |
33.85 (-27.79%) |
46.13 |
31.72 - 47.81 |
0.8543 times |
Fri 29 August 2025 |
46.88 (-6.33%) |
49.76 |
36.00 - 49.76 |
0.7994 times |
Thu 31 July 2025 |
50.05 (14.69%) |
44.55 |
43.00 - 56.50 |
1.1718 times |
Mon 30 June 2025 |
43.64 (8.96%) |
39.95 |
38.25 - 45.86 |
1.3242 times |
Fri 30 May 2025 |
40.05 (-39.02%) |
66.09 |
38.61 - 67.87 |
1.4053 times |
Wed 30 April 2025 |
65.68 (32.47%) |
49.99 |
46.80 - 70.26 |
1.11 times |
Mon 31 March 2025 |
49.58 (42.8%) |
35.13 |
30.79 - 50.40 |
0.7936 times |
Fri 28 February 2025 |
34.72 (-8.56%) |
36.51 |
31.34 - 37.62 |
0.473 times |
Fri 31 January 2025 |
37.97 (-18.78%) |
46.06 |
36.67 - 59.60 |
0.7409 times |
Tue 31 December 2024 |
46.75 (-6.97%) |
53.58 |
42.56 - 53.58 |
0.3499 times |
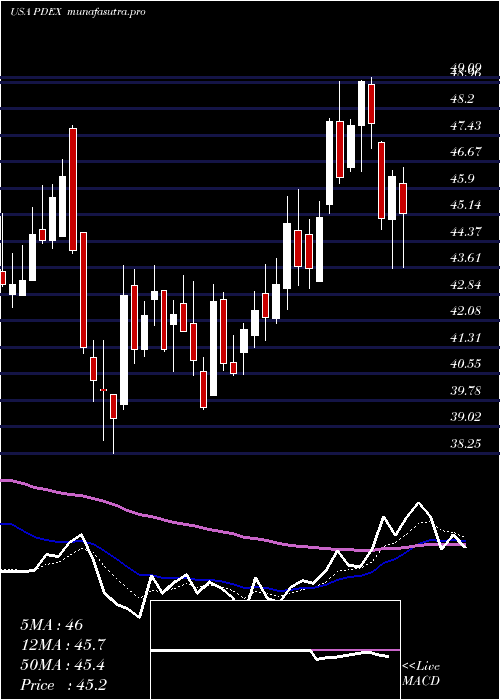
DMA SMA EMA moving averages of Pro Dex PDEX
DMA (daily moving average) of Pro Dex PDEX
| DMA period | DMA value | | 5 day DMA | 25.25 | | 12 day DMA | 29.69 | | 20 day DMA | 31.4 | | 35 day DMA | 33.8 | | 50 day DMA | 37.07 | | 100 day DMA | 40.96 | | 150 day DMA | 44.99 | | 200 day DMA | 43.79 | EMA (exponential moving average) of Pro Dex PDEX
| EMA period | EMA current | EMA prev | EMA prev2 | | 5 day EMA | 26.21 | 26.49 | 26.62 | | 12 day EMA | 28.62 | 29.16 | 29.69 | | 20 day EMA | 30.59 | 31.11 | 31.62 | | 35 day EMA | 33.84 | 34.32 | 34.8 | | 50 day EMA | 36.53 | 36.97 | 37.41 |
SMA (simple moving average) of Pro Dex PDEX
| SMA period | SMA current | SMA prev | SMA prev2 | | 5 day SMA | 25.25 | 25.42 | 26.85 | | 12 day SMA | 29.69 | 30.36 | 30.99 | | 20 day SMA | 31.4 | 31.83 | 32.24 | | 35 day SMA | 33.8 | 34.4 | 34.99 | | 50 day SMA | 37.07 | 37.33 | 37.76 | | 100 day SMA | 40.96 | 41.15 | 41.35 | | 150 day SMA | 44.99 | 45.15 | 45.28 | | 200 day SMA | 43.79 | 43.9 | 44 |
|
|
