PinduoduoInc PDD full analysis,charts,indicators,moving averages,SMA,DMA,EMA,ADX,MACD,RSIPinduoduo Inc PDD WideScreen charts, DMA,SMA,EMA technical analysis, forecast prediction, by indicators ADX,MACD,RSI,CCI USA stock exchange
operates under Miscellaneous sector & deals in Business Services
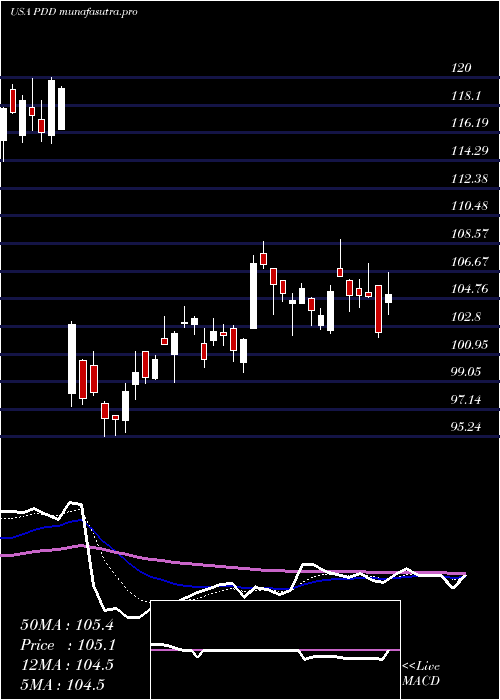
Daily price and charts and targets PinduoduoInc Strong Daily Stock price targets for PinduoduoInc PDD are 129.91 and 134.03 | Daily Target 1 | 126.63 | | Daily Target 2 | 129.07 | | Daily Target 3 | 130.74666666667 | | Daily Target 4 | 133.19 | | Daily Target 5 | 134.87 |
Daily price and volume Pinduoduo Inc
| Date |
Closing |
Open |
Range |
Volume |
Mon 20 October 2025 |
131.52 (1.99%) |
128.54 |
128.30 - 132.42 |
0.5389 times |
Fri 17 October 2025 |
128.96 (1.75%) |
123.80 |
122.77 - 130.23 |
0.5958 times |
Thu 16 October 2025 |
126.74 (-0.66%) |
127.60 |
126.22 - 128.50 |
0.3591 times |
Wed 15 October 2025 |
127.58 (0.38%) |
128.55 |
126.51 - 129.31 |
0.6364 times |
Tue 14 October 2025 |
127.10 (-0.35%) |
125.12 |
124.91 - 128.05 |
0.7578 times |
Mon 13 October 2025 |
127.55 (2.64%) |
128.00 |
126.81 - 129.59 |
1.4065 times |
Fri 10 October 2025 |
124.27 (-5.32%) |
130.26 |
122.92 - 132.33 |
3.079 times |
Thu 09 October 2025 |
131.25 (-1.88%) |
133.01 |
130.06 - 133.91 |
1.1956 times |
Wed 08 October 2025 |
133.77 (0.22%) |
133.79 |
133.19 - 135.14 |
0.7454 times |
Tue 07 October 2025 |
133.48 (-0.54%) |
134.57 |
132.41 - 134.72 |
0.6854 times |
Mon 06 October 2025 |
134.20 (-0.1%) |
134.02 |
132.97 - 135.36 |
0.7641 times |
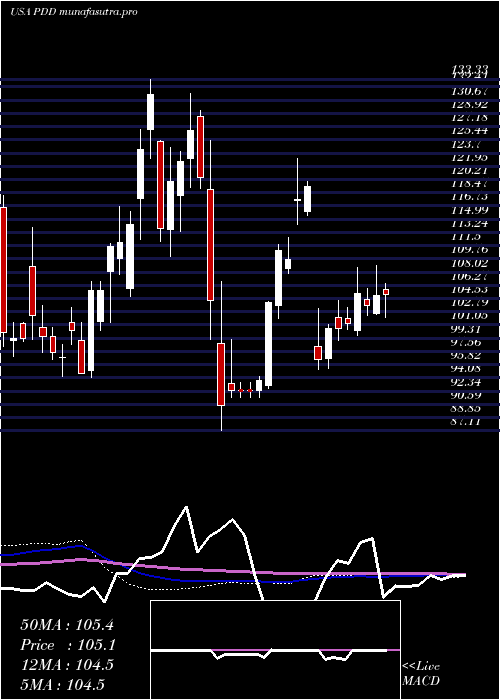
Weekly price and charts PinduoduoInc Strong weekly Stock price targets for PinduoduoInc PDD are 129.91 and 134.03 | Weekly Target 1 | 126.63 | | Weekly Target 2 | 129.07 | | Weekly Target 3 | 130.74666666667 | | Weekly Target 4 | 133.19 | | Weekly Target 5 | 134.87 |
Weekly price and volumes for Pinduoduo Inc
| Date |
Closing |
Open |
Range |
Volume |
Mon 20 October 2025 |
131.52 (1.99%) |
128.54 |
128.30 - 132.42 |
0.0991 times |
Fri 17 October 2025 |
128.96 (3.77%) |
128.00 |
122.77 - 130.23 |
0.6904 times |
Fri 10 October 2025 |
124.27 (-7.5%) |
134.02 |
122.92 - 135.36 |
1.1892 times |
Fri 03 October 2025 |
134.34 (3.35%) |
132.00 |
130.36 - 136.84 |
1.073 times |
Fri 26 September 2025 |
129.99 (0.4%) |
128.80 |
127.00 - 133.00 |
0.9115 times |
Fri 19 September 2025 |
129.47 (3.21%) |
126.06 |
124.51 - 135.37 |
1.948 times |
Fri 12 September 2025 |
125.44 (0.61%) |
125.71 |
123.49 - 128.00 |
0.987 times |
Fri 05 September 2025 |
124.68 (3.71%) |
119.39 |
118.77 - 126.59 |
0.8379 times |
Fri 29 August 2025 |
120.22 (0%) |
122.82 |
119.82 - 123.08 |
0.3095 times |
Fri 29 August 2025 |
120.22 (-5.42%) |
125.85 |
119.83 - 133.33 |
1.9545 times |
Fri 22 August 2025 |
127.11 (6.86%) |
120.50 |
117.25 - 129.00 |
1.3504 times |
Monthly price and charts PinduoduoInc Strong monthly Stock price targets for PinduoduoInc PDD are 120.11 and 134.18 | Monthly Target 1 | 116.31 | | Monthly Target 2 | 123.91 | | Monthly Target 3 | 130.37666666667 | | Monthly Target 4 | 137.98 | | Monthly Target 5 | 144.45 |
Monthly price and volumes Pinduoduo Inc
| Date |
Closing |
Open |
Range |
Volume |
Mon 20 October 2025 |
131.52 (-0.49%) |
133.00 |
122.77 - 136.84 |
0.5409 times |
Tue 30 September 2025 |
132.17 (9.94%) |
119.39 |
118.77 - 135.37 |
1.1297 times |
Fri 29 August 2025 |
120.22 (5.97%) |
111.20 |
108.86 - 133.33 |
1.1112 times |
Thu 31 July 2025 |
113.45 (8.4%) |
104.45 |
102.08 - 121.49 |
0.7642 times |
Mon 30 June 2025 |
104.66 (8.44%) |
96.68 |
95.32 - 108.68 |
0.7057 times |
Fri 30 May 2025 |
96.51 (-8.58%) |
106.36 |
95.24 - 122.99 |
1.1911 times |
Wed 30 April 2025 |
105.57 (-10.8%) |
119.23 |
87.11 - 125.40 |
1.5513 times |
Mon 31 March 2025 |
118.35 (4.1%) |
113.58 |
110.04 - 131.52 |
0.9323 times |
Fri 28 February 2025 |
113.69 (1.59%) |
105.80 |
104.80 - 133.33 |
1.1315 times |
Fri 31 January 2025 |
111.91 (15.38%) |
95.59 |
94.14 - 116.69 |
0.9421 times |
Tue 31 December 2024 |
96.99 (-2.34%) |
108.70 |
94.25 - 113.92 |
0.8138 times |
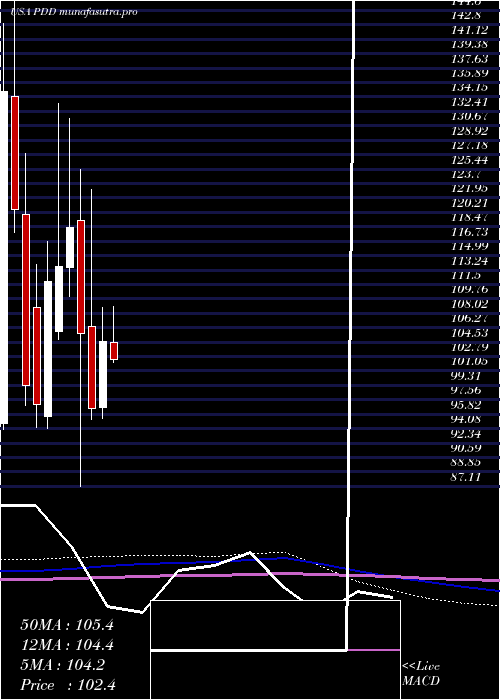
DMA SMA EMA moving averages of Pinduoduo Inc PDD
DMA (daily moving average) of Pinduoduo Inc PDD
| DMA period | DMA value | | 5 day DMA | 128.38 | | 12 day DMA | 130.06 | | 20 day DMA | 130.69 | | 35 day DMA | 129.07 | | 50 day DMA | 126.54 | | 100 day DMA | 116.5 | | 150 day DMA | 114.15 | | 200 day DMA | 113.56 | EMA (exponential moving average) of Pinduoduo Inc PDD
| EMA period | EMA current | EMA prev | EMA prev2 | | 5 day EMA | 129.26 | 128.13 | 127.71 | | 12 day EMA | 129.51 | 129.15 | 129.19 | | 20 day EMA | 129.45 | 129.23 | 129.26 | | 35 day EMA | 127.75 | 127.53 | 127.45 | | 50 day EMA | 125.68 | 125.44 | 125.3 |
SMA (simple moving average) of Pinduoduo Inc PDD
| SMA period | SMA current | SMA prev | SMA prev2 | | 5 day SMA | 128.38 | 127.59 | 126.65 | | 12 day SMA | 130.06 | 130.37 | 130.83 | | 20 day SMA | 130.69 | 130.54 | 130.56 | | 35 day SMA | 129.07 | 128.75 | 128.5 | | 50 day SMA | 126.54 | 126.17 | 125.87 | | 100 day SMA | 116.5 | 116.22 | 116.12 | | 150 day SMA | 114.15 | 114.06 | 113.99 | | 200 day SMA | 113.56 | 113.39 | 113.22 |
|
|
