PaylocityHolding PCTY full analysis,charts,indicators,moving averages,SMA,DMA,EMA,ADX,MACD,RSIPaylocity Holding PCTY WideScreen charts, DMA,SMA,EMA technical analysis, forecast prediction, by indicators ADX,MACD,RSI,CCI USA stock exchange
operates under Technology sector & deals in Computer Software Prepackaged Software
Daily price and charts and targets PaylocityHolding Strong Daily Stock price targets for PaylocityHolding PCTY are 151 and 153.34 | Daily Target 1 | 149.2 | | Daily Target 2 | 150.46 | | Daily Target 3 | 151.54333333333 | | Daily Target 4 | 152.8 | | Daily Target 5 | 153.88 |
Daily price and volume Paylocity Holding
| Date |
Closing |
Open |
Range |
Volume |
Mon 20 October 2025 |
151.71 (0.92%) |
150.29 |
150.29 - 152.63 |
0.6648 times |
Fri 17 October 2025 |
150.32 (1.2%) |
148.64 |
148.64 - 151.17 |
0.8048 times |
Thu 16 October 2025 |
148.54 (-0.88%) |
150.23 |
147.60 - 150.86 |
1.0617 times |
Wed 15 October 2025 |
149.86 (-0.93%) |
151.48 |
148.54 - 152.15 |
0.937 times |
Tue 14 October 2025 |
151.27 (-0.29%) |
150.56 |
149.69 - 152.50 |
1.5779 times |
Mon 13 October 2025 |
151.71 (0.81%) |
151.00 |
150.00 - 152.77 |
1.2627 times |
Fri 10 October 2025 |
150.49 (-1.63%) |
153.21 |
150.47 - 153.28 |
0.938 times |
Thu 09 October 2025 |
152.98 (-0.81%) |
154.41 |
152.46 - 154.41 |
0.7557 times |
Wed 08 October 2025 |
154.23 (0.65%) |
154.32 |
152.26 - 155.89 |
0.9236 times |
Tue 07 October 2025 |
153.23 (-2.04%) |
156.75 |
151.96 - 156.75 |
1.0738 times |
Mon 06 October 2025 |
156.42 (0.49%) |
155.76 |
154.21 - 157.46 |
1.228 times |
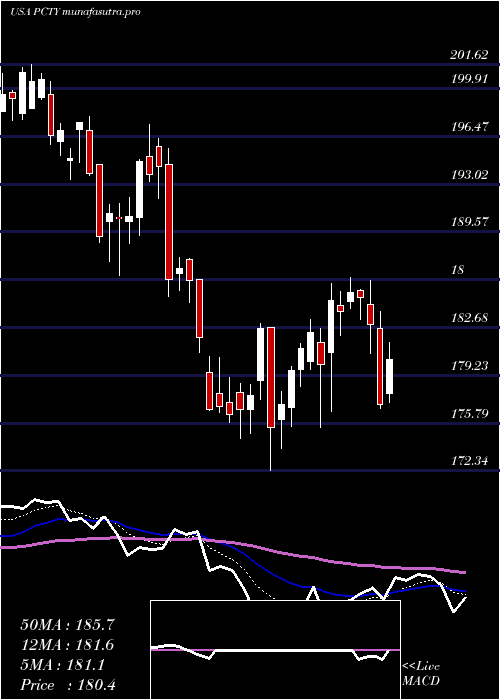
Weekly price and charts PaylocityHolding Strong weekly Stock price targets for PaylocityHolding PCTY are 151 and 153.34 | Weekly Target 1 | 149.2 | | Weekly Target 2 | 150.46 | | Weekly Target 3 | 151.54333333333 | | Weekly Target 4 | 152.8 | | Weekly Target 5 | 153.88 |
Weekly price and volumes for Paylocity Holding
| Date |
Closing |
Open |
Range |
Volume |
Mon 20 October 2025 |
151.71 (0.92%) |
150.29 |
150.29 - 152.63 |
0.1522 times |
Fri 17 October 2025 |
150.32 (-0.11%) |
151.00 |
147.60 - 152.77 |
1.2923 times |
Fri 10 October 2025 |
150.49 (-3.32%) |
155.76 |
150.47 - 157.46 |
1.1263 times |
Fri 03 October 2025 |
155.65 (-4.91%) |
163.99 |
151.71 - 164.28 |
1.5206 times |
Fri 26 September 2025 |
163.69 (-0.32%) |
162.98 |
162.50 - 169.56 |
1.2487 times |
Fri 19 September 2025 |
164.22 (-3.22%) |
170.37 |
163.60 - 170.50 |
1.2646 times |
Fri 12 September 2025 |
169.68 (-2.71%) |
174.90 |
168.41 - 176.15 |
1.3032 times |
Fri 05 September 2025 |
174.40 (-2.69%) |
177.42 |
171.91 - 178.91 |
0.8813 times |
Fri 29 August 2025 |
179.23 (0%) |
179.48 |
178.59 - 180.86 |
0.2212 times |
Fri 29 August 2025 |
179.23 (-1.69%) |
180.99 |
176.98 - 182.36 |
0.9896 times |
Fri 22 August 2025 |
182.31 (6.02%) |
172.83 |
171.24 - 182.83 |
1.0706 times |
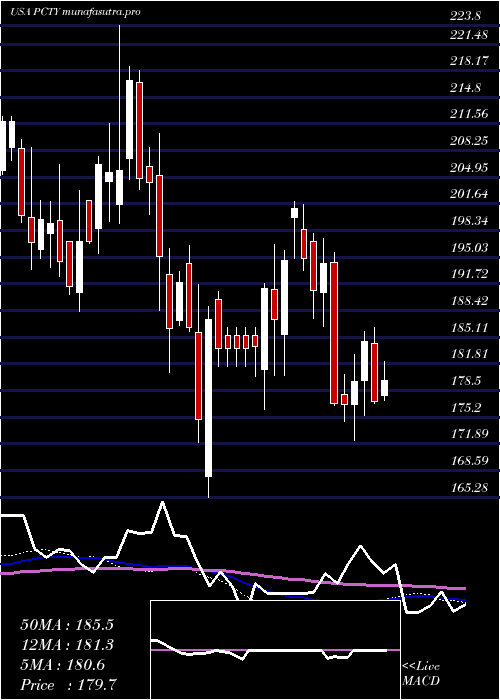
Monthly price and charts PaylocityHolding Strong monthly Stock price targets for PaylocityHolding PCTY are 142.88 and 156.44 | Monthly Target 1 | 139.93 | | Monthly Target 2 | 145.82 | | Monthly Target 3 | 153.49 | | Monthly Target 4 | 159.38 | | Monthly Target 5 | 167.05 |
Monthly price and volumes Paylocity Holding
| Date |
Closing |
Open |
Range |
Volume |
Mon 20 October 2025 |
151.71 (-4.75%) |
159.71 |
147.60 - 161.16 |
0.7924 times |
Tue 30 September 2025 |
159.27 (-11.14%) |
177.42 |
156.98 - 178.91 |
1.2506 times |
Fri 29 August 2025 |
179.23 (-3.06%) |
183.77 |
169.64 - 197.78 |
1.2379 times |
Thu 31 July 2025 |
184.88 (2.04%) |
180.22 |
175.45 - 190.61 |
1.0389 times |
Mon 30 June 2025 |
181.19 (-5.09%) |
190.61 |
172.34 - 197.32 |
1.1601 times |
Fri 30 May 2025 |
190.90 (-0.62%) |
192.98 |
180.33 - 201.97 |
0.8764 times |
Wed 30 April 2025 |
192.10 (2.54%) |
189.99 |
165.28 - 193.35 |
0.8013 times |
Mon 31 March 2025 |
187.34 (-8.3%) |
205.12 |
180.69 - 210.35 |
0.7559 times |
Fri 28 February 2025 |
204.29 (-0.6%) |
201.57 |
199.20 - 223.80 |
0.9418 times |
Fri 31 January 2025 |
205.52 (3.03%) |
200.27 |
188.26 - 211.64 |
1.1447 times |
Tue 31 December 2024 |
199.47 (-5.86%) |
208.48 |
193.50 - 209.59 |
0.5114 times |
DMA SMA EMA moving averages of Paylocity Holding PCTY
DMA (daily moving average) of Paylocity Holding PCTY
| DMA period | DMA value | | 5 day DMA | 150.34 | | 12 day DMA | 152.2 | | 20 day DMA | 155.74 | | 35 day DMA | 161.85 | | 50 day DMA | 166.54 | | 100 day DMA | 175.23 | | 150 day DMA | 179.97 | | 200 day DMA | 185.38 | EMA (exponential moving average) of Paylocity Holding PCTY
| EMA period | EMA current | EMA prev | EMA prev2 | | 5 day EMA | 150.84 | 150.41 | 150.46 | | 12 day EMA | 152.73 | 152.91 | 153.38 | | 20 day EMA | 155.6 | 156.01 | 156.61 | | 35 day EMA | 160.72 | 161.25 | 161.89 | | 50 day EMA | 166.05 | 166.63 | 167.3 |
SMA (simple moving average) of Paylocity Holding PCTY
| SMA period | SMA current | SMA prev | SMA prev2 | | 5 day SMA | 150.34 | 150.34 | 150.37 | | 12 day SMA | 152.2 | 152.48 | 152.71 | | 20 day SMA | 155.74 | 156.56 | 157.25 | | 35 day SMA | 161.85 | 162.64 | 163.46 | | 50 day SMA | 166.54 | 166.95 | 167.48 | | 100 day SMA | 175.23 | 175.68 | 176.13 | | 150 day SMA | 179.97 | 180.2 | 180.42 | | 200 day SMA | 185.38 | 185.6 | 185.84 |
|
|
