PimcoCorporate PCN full analysis,charts,indicators,moving averages,SMA,DMA,EMA,ADX,MACD,RSIPimco Corporate PCN WideScreen charts, DMA,SMA,EMA technical analysis, forecast prediction, by indicators ADX,MACD,RSI,CCI USA stock exchange
operates under N A sector & deals in N A
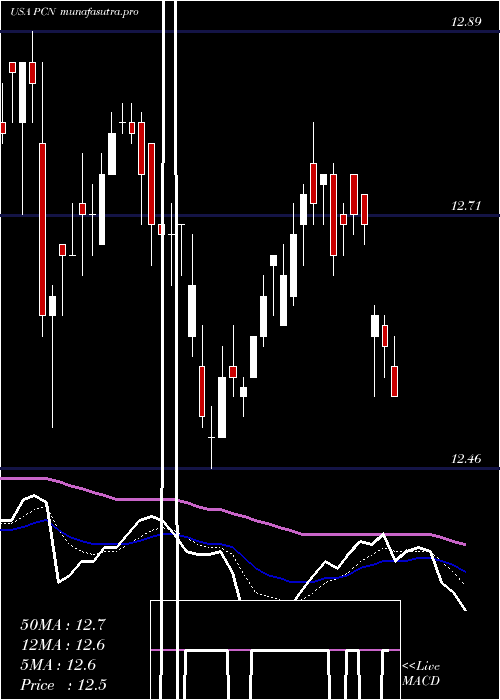
Daily price and charts and targets PimcoCorporate Strong Daily Stock price targets for PimcoCorporate PCN are 12.6 and 12.69 | Daily Target 1 | 12.53 | | Daily Target 2 | 12.57 | | Daily Target 3 | 12.616666666667 | | Daily Target 4 | 12.66 | | Daily Target 5 | 12.71 |
Daily price and volume Pimco Corporate
| Date |
Closing |
Open |
Range |
Volume |
Thu 04 December 2025 |
12.62 (-0.08%) |
12.58 |
12.57 - 12.66 |
0.8999 times |
Wed 03 December 2025 |
12.63 (0%) |
12.55 |
12.49 - 12.66 |
1.0103 times |
Tue 02 December 2025 |
12.63 (-0.24%) |
12.66 |
12.57 - 12.68 |
0.8493 times |
Mon 01 December 2025 |
12.66 (-0.86%) |
12.65 |
12.62 - 12.74 |
1.2298 times |
Fri 28 November 2025 |
12.77 (0.16%) |
12.75 |
12.69 - 12.78 |
0.6225 times |
Wed 26 November 2025 |
12.75 (0.39%) |
12.68 |
12.68 - 12.77 |
0.7077 times |
Tue 25 November 2025 |
12.70 (0.71%) |
12.67 |
12.63 - 12.72 |
0.8201 times |
Mon 24 November 2025 |
12.61 (0.88%) |
12.51 |
12.51 - 12.65 |
1.0804 times |
Fri 21 November 2025 |
12.50 (1.3%) |
12.36 |
12.36 - 12.51 |
1.2673 times |
Thu 20 November 2025 |
12.34 (-0.64%) |
12.46 |
12.24 - 12.53 |
1.5128 times |
Wed 19 November 2025 |
12.42 (-0.4%) |
12.48 |
12.41 - 12.57 |
1.2534 times |
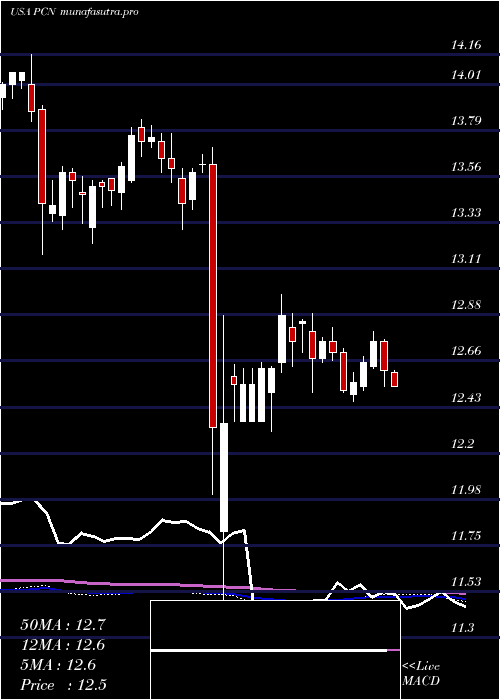
Weekly price and charts PimcoCorporate Strong weekly Stock price targets for PimcoCorporate PCN are 12.43 and 12.68 | Weekly Target 1 | 12.37 | | Weekly Target 2 | 12.49 | | Weekly Target 3 | 12.616666666667 | | Weekly Target 4 | 12.74 | | Weekly Target 5 | 12.87 |
Weekly price and volumes for Pimco Corporate
| Date |
Closing |
Open |
Range |
Volume |
Thu 04 December 2025 |
12.62 (-1.17%) |
12.65 |
12.49 - 12.74 |
0.9184 times |
Fri 28 November 2025 |
12.77 (2.16%) |
12.51 |
12.51 - 12.78 |
0.7437 times |
Fri 21 November 2025 |
12.50 (-0.87%) |
12.53 |
12.24 - 12.61 |
1.4115 times |
Fri 14 November 2025 |
12.61 (-1.79%) |
12.85 |
12.50 - 12.96 |
1.0019 times |
Fri 07 November 2025 |
12.84 (-2.21%) |
12.99 |
12.80 - 13.06 |
0.761 times |
Fri 31 October 2025 |
13.13 (0%) |
13.19 |
13.05 - 13.19 |
0.2029 times |
Fri 31 October 2025 |
13.13 (0.77%) |
13.14 |
12.88 - 13.19 |
0.9951 times |
Fri 24 October 2025 |
13.03 (1.56%) |
12.82 |
12.46 - 13.10 |
1.7697 times |
Fri 17 October 2025 |
12.83 (-4.33%) |
13.47 |
12.75 - 13.47 |
1.7774 times |
Tue 07 October 2025 |
13.41 (0%) |
13.44 |
13.37 - 13.44 |
0.4183 times |
Fri 03 October 2025 |
13.41 (0.3%) |
13.44 |
13.30 - 13.44 |
1.0358 times |
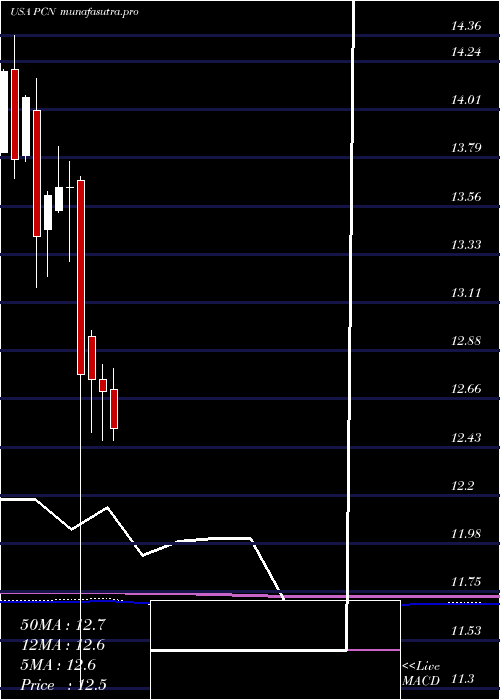
Monthly price and charts PimcoCorporate Strong monthly Stock price targets for PimcoCorporate PCN are 12.43 and 12.68 | Monthly Target 1 | 12.37 | | Monthly Target 2 | 12.49 | | Monthly Target 3 | 12.616666666667 | | Monthly Target 4 | 12.74 | | Monthly Target 5 | 12.87 |
Monthly price and volumes Pimco Corporate
| Date |
Closing |
Open |
Range |
Volume |
Thu 04 December 2025 |
12.62 (-1.17%) |
12.65 |
12.49 - 12.74 |
0.2237 times |
Fri 28 November 2025 |
12.77 (-2.74%) |
12.99 |
12.24 - 13.06 |
0.9546 times |
Fri 31 October 2025 |
13.13 (-1.87%) |
13.40 |
12.46 - 13.47 |
1.3953 times |
Tue 30 September 2025 |
13.38 (2.37%) |
13.05 |
12.96 - 13.46 |
1.297 times |
Fri 29 August 2025 |
13.07 (3.48%) |
12.61 |
12.58 - 13.07 |
1.1085 times |
Thu 31 July 2025 |
12.63 (-0.47%) |
12.70 |
12.46 - 12.80 |
1.0704 times |
Mon 30 June 2025 |
12.69 (-0.47%) |
12.75 |
12.46 - 12.82 |
0.8855 times |
Fri 30 May 2025 |
12.75 (-0.16%) |
12.95 |
12.50 - 12.98 |
0.8874 times |
Wed 30 April 2025 |
12.77 (-6.45%) |
13.68 |
11.30 - 13.70 |
1.4225 times |
Mon 31 March 2025 |
13.65 (0%) |
13.65 |
13.30 - 13.77 |
0.7549 times |
Fri 28 February 2025 |
13.65 (0.29%) |
13.54 |
13.53 - 13.84 |
0.6487 times |
DMA SMA EMA moving averages of Pimco Corporate PCN
DMA (daily moving average) of Pimco Corporate PCN
| DMA period | DMA value | | 5 day DMA | 12.66 | | 12 day DMA | 12.59 | | 20 day DMA | 12.67 | | 35 day DMA | 12.81 | | 50 day DMA | 12.98 | | 100 day DMA | 12.91 | | 150 day DMA | 12.85 | | 200 day DMA | 12.94 | EMA (exponential moving average) of Pimco Corporate PCN
| EMA period | EMA current | EMA prev | EMA prev2 | | 5 day EMA | 12.64 | 12.65 | 12.66 | | 12 day EMA | 12.66 | 12.67 | 12.68 | | 20 day EMA | 12.7 | 12.71 | 12.72 | | 35 day EMA | 12.83 | 12.84 | 12.85 | | 50 day EMA | 12.99 | 13 | 13.01 |
SMA (simple moving average) of Pimco Corporate PCN
| SMA period | SMA current | SMA prev | SMA prev2 | | 5 day SMA | 12.66 | 12.69 | 12.7 | | 12 day SMA | 12.59 | 12.59 | 12.58 | | 20 day SMA | 12.67 | 12.69 | 12.7 | | 35 day SMA | 12.81 | 12.83 | 12.84 | | 50 day SMA | 12.98 | 12.99 | 13.01 | | 100 day SMA | 12.91 | 12.92 | 12.92 | | 150 day SMA | 12.85 | 12.85 | 12.85 | | 200 day SMA | 12.94 | 12.95 | 12.95 |
|
|
