PacificGas PCG full analysis,charts,indicators,moving averages,SMA,DMA,EMA,ADX,MACD,RSIPacific Gas PCG WideScreen charts, DMA,SMA,EMA technical analysis, forecast prediction, by indicators ADX,MACD,RSI,CCI USA stock exchange
operates under Public Utilities sector & deals in Power Generation
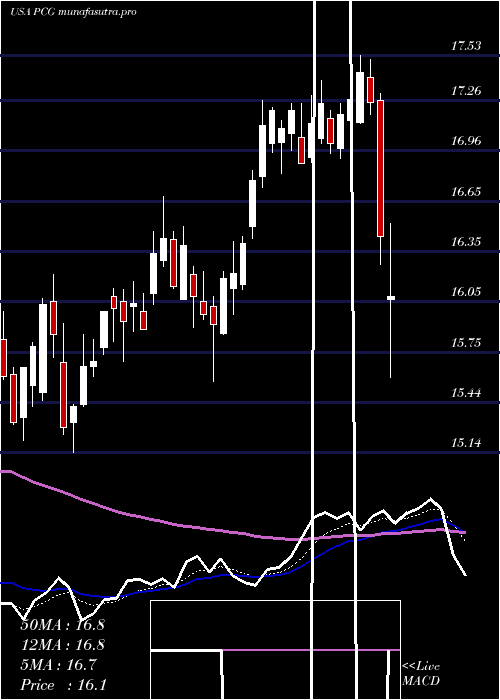
Daily price and charts and targets PacificGas Strong Daily Stock price targets for PacificGas PCG are 15.05 and 15.27 | Daily Target 1 | 15.01 | | Daily Target 2 | 15.09 | | Daily Target 3 | 15.233333333333 | | Daily Target 4 | 15.31 | | Daily Target 5 | 15.45 |
Daily price and volume Pacific Gas
| Date |
Closing |
Open |
Range |
Volume |
Fri 05 December 2025 |
15.16 (-1.11%) |
15.31 |
15.16 - 15.38 |
0.7419 times |
Thu 04 December 2025 |
15.33 (0.66%) |
15.18 |
15.13 - 15.43 |
0.6296 times |
Wed 03 December 2025 |
15.23 (-0.72%) |
15.37 |
15.06 - 15.48 |
1.2681 times |
Tue 02 December 2025 |
15.34 (-3.16%) |
15.85 |
15.30 - 15.98 |
0.8205 times |
Mon 01 December 2025 |
15.84 (-1.74%) |
16.02 |
15.75 - 16.03 |
0.7397 times |
Fri 28 November 2025 |
16.12 (0.69%) |
16.10 |
15.97 - 16.20 |
0.2639 times |
Wed 26 November 2025 |
16.01 (1.78%) |
15.89 |
15.77 - 16.09 |
0.9824 times |
Tue 25 November 2025 |
15.73 (-1.38%) |
15.95 |
15.70 - 16.06 |
1.1754 times |
Mon 24 November 2025 |
15.95 (1.79%) |
15.73 |
15.62 - 16.02 |
1.644 times |
Fri 21 November 2025 |
15.67 (-1.07%) |
15.98 |
15.61 - 15.99 |
1.7344 times |
Thu 20 November 2025 |
15.84 (0.76%) |
15.89 |
15.77 - 16.08 |
1.5071 times |
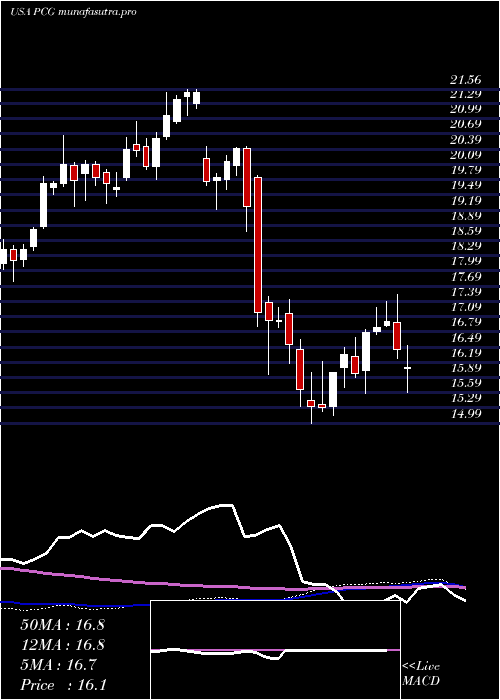
Weekly price and charts PacificGas Strong weekly Stock price targets for PacificGas PCG are 14.63 and 15.6 | Weekly Target 1 | 14.45 | | Weekly Target 2 | 14.8 | | Weekly Target 3 | 15.416666666667 | | Weekly Target 4 | 15.77 | | Weekly Target 5 | 16.39 |
Weekly price and volumes for Pacific Gas
| Date |
Closing |
Open |
Range |
Volume |
Fri 05 December 2025 |
15.16 (-5.96%) |
16.02 |
15.06 - 16.03 |
1.1653 times |
Fri 28 November 2025 |
16.12 (2.87%) |
15.73 |
15.62 - 16.20 |
1.1281 times |
Fri 21 November 2025 |
15.67 (-4.97%) |
16.44 |
15.59 - 16.65 |
1.9577 times |
Fri 14 November 2025 |
16.49 (-0.12%) |
16.51 |
16.38 - 16.85 |
1.0933 times |
Fri 07 November 2025 |
16.51 (3.45%) |
15.82 |
15.50 - 16.60 |
1.0383 times |
Fri 31 October 2025 |
15.96 (0%) |
15.80 |
15.66 - 16.01 |
0.1748 times |
Fri 31 October 2025 |
15.96 (-2.68%) |
16.42 |
15.66 - 16.52 |
1.0005 times |
Fri 24 October 2025 |
16.40 (-0.12%) |
16.50 |
16.12 - 17.07 |
0.8328 times |
Fri 17 October 2025 |
16.42 (1.36%) |
15.92 |
15.88 - 16.91 |
0.931 times |
Tue 07 October 2025 |
16.20 (1.76%) |
15.89 |
15.86 - 16.46 |
0.6783 times |
Fri 03 October 2025 |
15.92 (6.35%) |
14.99 |
14.80 - 15.97 |
1.3292 times |
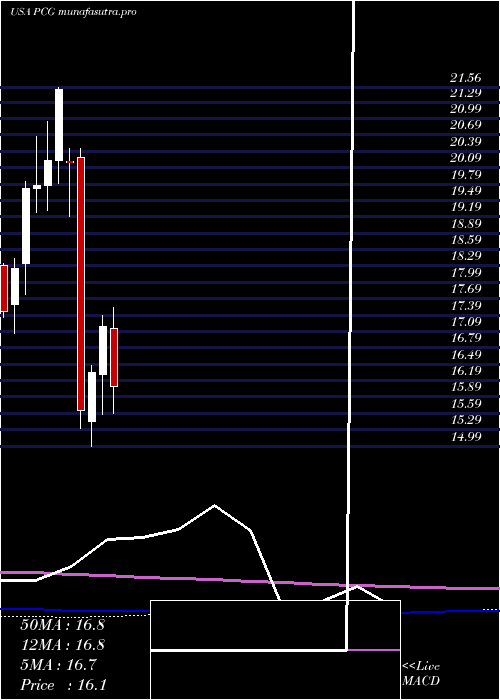
Monthly price and charts PacificGas Strong monthly Stock price targets for PacificGas PCG are 14.63 and 15.6 | Monthly Target 1 | 14.45 | | Monthly Target 2 | 14.8 | | Monthly Target 3 | 15.416666666667 | | Monthly Target 4 | 15.77 | | Monthly Target 5 | 16.39 |
Monthly price and volumes Pacific Gas
| Date |
Closing |
Open |
Range |
Volume |
Fri 05 December 2025 |
15.16 (-5.96%) |
16.02 |
15.06 - 16.03 |
0.2527 times |
Fri 28 November 2025 |
16.12 (1%) |
15.82 |
15.50 - 16.85 |
1.1314 times |
Fri 31 October 2025 |
15.96 (5.84%) |
15.16 |
15.13 - 17.07 |
0.9564 times |
Tue 30 September 2025 |
15.08 (-1.31%) |
15.13 |
14.34 - 16.09 |
1.2611 times |
Fri 29 August 2025 |
15.28 (8.99%) |
14.00 |
13.79 - 15.77 |
1.2219 times |
Thu 31 July 2025 |
14.02 (0.57%) |
13.91 |
12.97 - 14.27 |
1.2511 times |
Mon 30 June 2025 |
13.94 (-17.42%) |
16.75 |
13.34 - 16.80 |
1.6451 times |
Fri 30 May 2025 |
16.88 (2.18%) |
16.68 |
16.59 - 17.95 |
0.6632 times |
Wed 30 April 2025 |
16.52 (-3.84%) |
17.14 |
15.47 - 17.78 |
0.8405 times |
Mon 31 March 2025 |
17.18 (5.14%) |
16.30 |
15.57 - 17.38 |
0.7765 times |
Fri 28 February 2025 |
16.34 (4.41%) |
15.44 |
14.99 - 16.47 |
1.048 times |
DMA SMA EMA moving averages of Pacific Gas PCG
DMA (daily moving average) of Pacific Gas PCG
| DMA period | DMA value | | 5 day DMA | 15.38 | | 12 day DMA | 15.66 | | 20 day DMA | 16 | | 35 day DMA | 16.12 | | 50 day DMA | 15.96 | | 100 day DMA | 15.33 | | 150 day DMA | 15.43 | | 200 day DMA | 15.74 | EMA (exponential moving average) of Pacific Gas PCG
| EMA period | EMA current | EMA prev | EMA prev2 | | 5 day EMA | 15.37 | 15.48 | 15.56 | | 12 day EMA | 15.65 | 15.74 | 15.81 | | 20 day EMA | 15.78 | 15.85 | 15.91 | | 35 day EMA | 15.84 | 15.88 | 15.91 | | 50 day EMA | 15.82 | 15.85 | 15.87 |
SMA (simple moving average) of Pacific Gas PCG
| SMA period | SMA current | SMA prev | SMA prev2 | | 5 day SMA | 15.38 | 15.57 | 15.71 | | 12 day SMA | 15.66 | 15.75 | 15.83 | | 20 day SMA | 16 | 16.06 | 16.11 | | 35 day SMA | 16.12 | 16.16 | 16.19 | | 50 day SMA | 15.96 | 15.95 | 15.94 | | 100 day SMA | 15.33 | 15.31 | 15.3 | | 150 day SMA | 15.43 | 15.45 | 15.46 | | 200 day SMA | 15.74 | 15.74 | 15.75 |
|
|
