HighIncome PCF full analysis,charts,indicators,moving averages,SMA,DMA,EMA,ADX,MACD,RSIHigh Income PCF WideScreen charts, DMA,SMA,EMA technical analysis, forecast prediction, by indicators ADX,MACD,RSI,CCI USA stock exchange
operates under N A sector & deals in N A
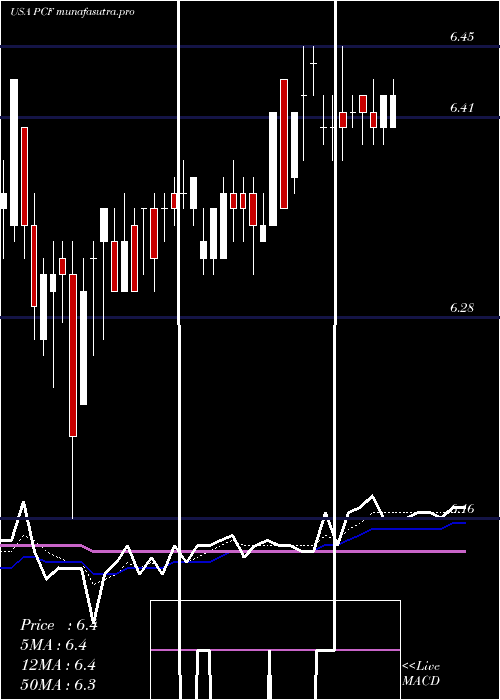
Daily price and charts and targets HighIncome Strong Daily Stock price targets for HighIncome PCF are 6.2 and 6.27 | Daily Target 1 | 6.14 | | Daily Target 2 | 6.18 | | Daily Target 3 | 6.21 | | Daily Target 4 | 6.25 | | Daily Target 5 | 6.28 |
Daily price and volume High Income
| Date |
Closing |
Open |
Range |
Volume |
Tue 21 October 2025 |
6.22 (-0.64%) |
6.17 |
6.17 - 6.24 |
0.9647 times |
Mon 20 October 2025 |
6.26 (-0.16%) |
6.37 |
6.26 - 6.37 |
0.9547 times |
Fri 17 October 2025 |
6.27 (0.16%) |
6.27 |
6.26 - 6.29 |
0.7042 times |
Thu 16 October 2025 |
6.26 (-1.11%) |
6.30 |
6.26 - 6.34 |
1.0465 times |
Wed 15 October 2025 |
6.33 (0.64%) |
6.32 |
6.29 - 6.35 |
0.7607 times |
Tue 14 October 2025 |
6.29 (0.16%) |
6.27 |
6.25 - 6.31 |
0.9015 times |
Mon 13 October 2025 |
6.28 (0.32%) |
6.25 |
6.20 - 6.30 |
0.8188 times |
Tue 07 October 2025 |
6.26 (0.32%) |
6.27 |
6.25 - 6.31 |
1.3973 times |
Mon 06 October 2025 |
6.24 (-0.64%) |
6.28 |
6.21 - 6.33 |
1.6234 times |
Fri 03 October 2025 |
6.28 (-0.79%) |
6.31 |
6.28 - 6.34 |
0.8281 times |
Thu 02 October 2025 |
6.33 (0.48%) |
6.33 |
6.31 - 6.37 |
0.3794 times |
Weekly price and charts HighIncome Strong weekly Stock price targets for HighIncome PCF are 6.1 and 6.3 | Weekly Target 1 | 6.05 | | Weekly Target 2 | 6.14 | | Weekly Target 3 | 6.2533333333333 | | Weekly Target 4 | 6.34 | | Weekly Target 5 | 6.45 |
Weekly price and volumes for High Income
| Date |
Closing |
Open |
Range |
Volume |
Tue 21 October 2025 |
6.22 (-0.8%) |
6.37 |
6.17 - 6.37 |
0.6508 times |
Fri 17 October 2025 |
6.27 (0.16%) |
6.25 |
6.20 - 6.35 |
1.4347 times |
Tue 07 October 2025 |
6.26 (-0.32%) |
6.28 |
6.21 - 6.33 |
1.0242 times |
Fri 03 October 2025 |
6.28 (-1.1%) |
6.35 |
6.28 - 6.40 |
1.4547 times |
Fri 26 September 2025 |
6.35 (-1.7%) |
6.45 |
6.35 - 6.47 |
0.9072 times |
Fri 19 September 2025 |
6.46 (0.16%) |
6.46 |
6.40 - 6.47 |
0.6968 times |
Fri 12 September 2025 |
6.45 (0.47%) |
6.40 |
6.38 - 6.45 |
1.4201 times |
Fri 05 September 2025 |
6.42 (-1.08%) |
6.47 |
6.41 - 6.49 |
0.9529 times |
Fri 29 August 2025 |
6.49 (0%) |
6.51 |
6.45 - 6.51 |
0.2445 times |
Fri 29 August 2025 |
6.49 (1.09%) |
6.44 |
6.40 - 6.51 |
1.2143 times |
Fri 22 August 2025 |
6.42 (-0.16%) |
6.43 |
6.34 - 6.45 |
0.9475 times |

Monthly price and charts HighIncome Strong monthly Stock price targets for HighIncome PCF are 6.09 and 6.3 | Monthly Target 1 | 6.05 | | Monthly Target 2 | 6.13 | | Monthly Target 3 | 6.2566666666667 | | Monthly Target 4 | 6.34 | | Monthly Target 5 | 6.47 |
Monthly price and volumes High Income
| Date |
Closing |
Open |
Range |
Volume |
Tue 21 October 2025 |
6.22 (-2.05%) |
6.32 |
6.17 - 6.38 |
0.9291 times |
Tue 30 September 2025 |
6.35 (-2.16%) |
6.47 |
6.31 - 6.49 |
1.1128 times |
Fri 29 August 2025 |
6.49 (2.2%) |
6.34 |
6.31 - 6.51 |
0.8916 times |
Thu 31 July 2025 |
6.35 (0%) |
6.37 |
6.28 - 6.45 |
0.9855 times |
Mon 30 June 2025 |
6.35 (0.47%) |
6.33 |
6.27 - 6.43 |
0.7823 times |
Fri 30 May 2025 |
6.32 (0.8%) |
6.33 |
6.16 - 6.43 |
0.9311 times |
Wed 30 April 2025 |
6.27 (-5.71%) |
6.62 |
5.73 - 6.64 |
1.0491 times |
Mon 31 March 2025 |
6.65 (-2.49%) |
6.83 |
6.54 - 6.87 |
0.7198 times |
Fri 28 February 2025 |
6.82 (1.19%) |
6.68 |
6.67 - 6.89 |
1.1139 times |
Fri 31 January 2025 |
6.74 (3.22%) |
6.48 |
6.47 - 6.74 |
1.4849 times |
Tue 31 December 2024 |
6.53 (-3.26%) |
6.78 |
6.30 - 6.85 |
1.7011 times |

DMA SMA EMA moving averages of High Income PCF
DMA (daily moving average) of High Income PCF
| DMA period | DMA value | | 5 day DMA | 6.27 | | 12 day DMA | 6.28 | | 20 day DMA | 6.32 | | 35 day DMA | 6.38 | | 50 day DMA | 6.39 | | 100 day DMA | 6.37 | | 150 day DMA | 6.35 | | 200 day DMA | 6.43 | EMA (exponential moving average) of High Income PCF
| EMA period | EMA current | EMA prev | EMA prev2 | | 5 day EMA | 6.25 | 6.27 | 6.28 | | 12 day EMA | 6.28 | 6.29 | 6.3 | | 20 day EMA | 6.3 | 6.31 | 6.32 | | 35 day EMA | 6.33 | 6.34 | 6.35 | | 50 day EMA | 6.37 | 6.38 | 6.38 |
SMA (simple moving average) of High Income PCF
| SMA period | SMA current | SMA prev | SMA prev2 | | 5 day SMA | 6.27 | 6.28 | 6.29 | | 12 day SMA | 6.28 | 6.29 | 6.3 | | 20 day SMA | 6.32 | 6.33 | 6.34 | | 35 day SMA | 6.38 | 6.38 | 6.39 | | 50 day SMA | 6.39 | 6.39 | 6.39 | | 100 day SMA | 6.37 | 6.37 | 6.37 | | 150 day SMA | 6.35 | 6.35 | 6.36 | | 200 day SMA | 6.43 | 6.43 | 6.44 |
|
|
