PacificCity PCB full analysis,charts,indicators,moving averages,SMA,DMA,EMA,ADX,MACD,RSIPacific City PCB WideScreen charts, DMA,SMA,EMA technical analysis, forecast prediction, by indicators ADX,MACD,RSI,CCI USA stock exchange
operates under Finance sector & deals in Major Banks
Daily price and charts and targets PacificCity Strong Daily Stock price targets for PacificCity PCB are 21.07 and 21.63 | Daily Target 1 | 20.91 | | Daily Target 2 | 21.23 | | Daily Target 3 | 21.47 | | Daily Target 4 | 21.79 | | Daily Target 5 | 22.03 |
Daily price and volume Pacific City
| Date |
Closing |
Open |
Range |
Volume |
Fri 05 December 2025 |
21.55 (-1.15%) |
21.65 |
21.15 - 21.71 |
1.5889 times |
Thu 04 December 2025 |
21.80 (-1.18%) |
22.11 |
21.57 - 22.11 |
1.3579 times |
Wed 03 December 2025 |
22.06 (2.99%) |
21.60 |
21.58 - 22.08 |
0.8628 times |
Tue 02 December 2025 |
21.42 (-1.88%) |
21.98 |
21.42 - 21.98 |
0.5328 times |
Mon 01 December 2025 |
21.83 (0.51%) |
21.56 |
21.56 - 21.94 |
0.5092 times |
Fri 28 November 2025 |
21.72 (-1.59%) |
21.88 |
21.61 - 21.94 |
0.4479 times |
Wed 26 November 2025 |
22.07 (-0.23%) |
22.00 |
21.85 - 22.44 |
1.1174 times |
Tue 25 November 2025 |
22.12 (1.98%) |
21.60 |
20.97 - 22.23 |
1.0467 times |
Mon 24 November 2025 |
21.69 (0.09%) |
21.72 |
21.49 - 21.72 |
0.9194 times |
Fri 21 November 2025 |
21.67 (2.31%) |
21.20 |
20.87 - 21.81 |
1.6172 times |
Thu 20 November 2025 |
21.18 (-0.38%) |
21.34 |
21.10 - 21.57 |
1.3626 times |
Weekly price and charts PacificCity Strong weekly Stock price targets for PacificCity PCB are 20.87 and 21.83 | Weekly Target 1 | 20.64 | | Weekly Target 2 | 21.1 | | Weekly Target 3 | 21.603333333333 | | Weekly Target 4 | 22.06 | | Weekly Target 5 | 22.56 |
Weekly price and volumes for Pacific City
| Date |
Closing |
Open |
Range |
Volume |
Fri 05 December 2025 |
21.55 (-0.78%) |
21.56 |
21.15 - 22.11 |
0.8819 times |
Fri 28 November 2025 |
21.72 (0.23%) |
21.72 |
20.97 - 22.44 |
0.6419 times |
Fri 21 November 2025 |
21.67 (-0.09%) |
21.72 |
20.87 - 21.81 |
1.0105 times |
Fri 14 November 2025 |
21.69 (0.28%) |
21.96 |
21.07 - 22.43 |
1.1133 times |
Fri 07 November 2025 |
21.63 (2.66%) |
21.55 |
21.15 - 22.04 |
1.271 times |
Fri 31 October 2025 |
21.07 (0%) |
20.82 |
20.78 - 21.23 |
0.2443 times |
Fri 31 October 2025 |
21.07 (-1.91%) |
21.59 |
20.78 - 22.04 |
1.5101 times |
Fri 24 October 2025 |
21.48 (7.56%) |
20.19 |
20.12 - 21.65 |
1.2213 times |
Fri 17 October 2025 |
19.97 (0.66%) |
20.08 |
19.70 - 20.75 |
1.1913 times |
Fri 10 October 2025 |
19.84 (-4.02%) |
20.82 |
19.80 - 21.00 |
0.9145 times |
Fri 03 October 2025 |
20.67 (-2.45%) |
21.23 |
20.52 - 21.23 |
0.8666 times |

Monthly price and charts PacificCity Strong monthly Stock price targets for PacificCity PCB are 20.87 and 21.83 | Monthly Target 1 | 20.64 | | Monthly Target 2 | 21.1 | | Monthly Target 3 | 21.603333333333 | | Monthly Target 4 | 22.06 | | Monthly Target 5 | 22.56 |
Monthly price and volumes Pacific City
| Date |
Closing |
Open |
Range |
Volume |
Fri 05 December 2025 |
21.55 (-0.78%) |
21.56 |
21.15 - 22.11 |
0.1834 times |
Fri 28 November 2025 |
21.72 (3.08%) |
21.55 |
20.87 - 22.44 |
0.8396 times |
Fri 31 October 2025 |
21.07 (0.33%) |
20.89 |
19.70 - 22.04 |
1.1452 times |
Tue 30 September 2025 |
21.00 (-4.98%) |
21.90 |
20.67 - 22.19 |
0.8322 times |
Fri 29 August 2025 |
22.10 (8.12%) |
20.31 |
19.87 - 22.45 |
1.0332 times |
Thu 31 July 2025 |
20.44 (-2.57%) |
20.76 |
20.29 - 22.37 |
0.9729 times |
Mon 30 June 2025 |
20.98 (8.48%) |
19.38 |
18.78 - 21.17 |
1.1785 times |
Fri 30 May 2025 |
19.34 (-1.38%) |
19.44 |
19.19 - 20.97 |
1.6135 times |
Wed 30 April 2025 |
19.61 (4.81%) |
18.52 |
16.00 - 19.97 |
1.4885 times |
Mon 31 March 2025 |
18.71 (-4.78%) |
19.75 |
18.16 - 19.95 |
0.7128 times |
Fri 28 February 2025 |
19.65 (1.87%) |
18.96 |
18.66 - 20.70 |
0.9885 times |

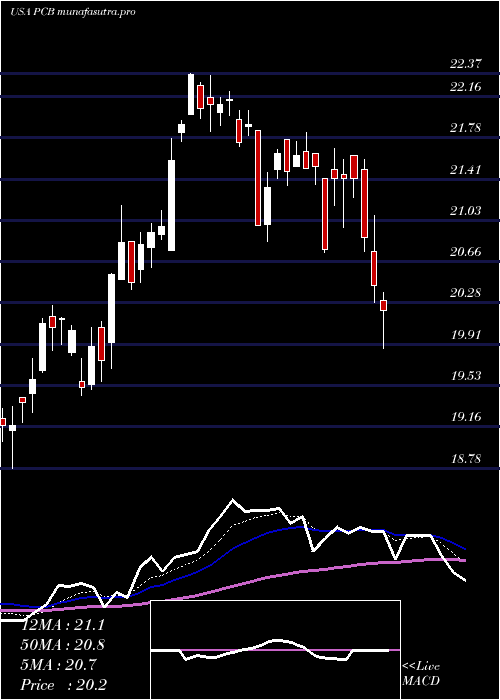
DMA SMA EMA moving averages of Pacific City PCB
DMA (daily moving average) of Pacific City PCB
| DMA period | DMA value | | 5 day DMA | 21.73 | | 12 day DMA | 21.7 | | 20 day DMA | 21.67 | | 35 day DMA | 21.39 | | 50 day DMA | 21.13 | | 100 day DMA | 21.32 | | 150 day DMA | 21.01 | | 200 day DMA | 20.43 | EMA (exponential moving average) of Pacific City PCB
| EMA period | EMA current | EMA prev | EMA prev2 | | 5 day EMA | 21.72 | 21.8 | 21.8 | | 12 day EMA | 21.69 | 21.72 | 21.7 | | 20 day EMA | 21.62 | 21.63 | 21.61 | | 35 day EMA | 21.41 | 21.4 | 21.38 | | 50 day EMA | 21.2 | 21.19 | 21.16 |
SMA (simple moving average) of Pacific City PCB
| SMA period | SMA current | SMA prev | SMA prev2 | | 5 day SMA | 21.73 | 21.77 | 21.82 | | 12 day SMA | 21.7 | 21.66 | 21.6 | | 20 day SMA | 21.67 | 21.67 | 21.67 | | 35 day SMA | 21.39 | 21.34 | 21.31 | | 50 day SMA | 21.13 | 21.12 | 21.1 | | 100 day SMA | 21.32 | 21.31 | 21.31 | | 150 day SMA | 21.01 | 21 | 20.99 | | 200 day SMA | 20.43 | 20.42 | 20.41 |
|
|
