PitneyBowes PBI full analysis,charts,indicators,moving averages,SMA,DMA,EMA,ADX,MACD,RSIPitney Bowes PBI WideScreen charts, DMA,SMA,EMA technical analysis, forecast prediction, by indicators ADX,MACD,RSI,CCI USA stock exchange
operates under Miscellaneous sector & deals in Office Equipment Supplies Services
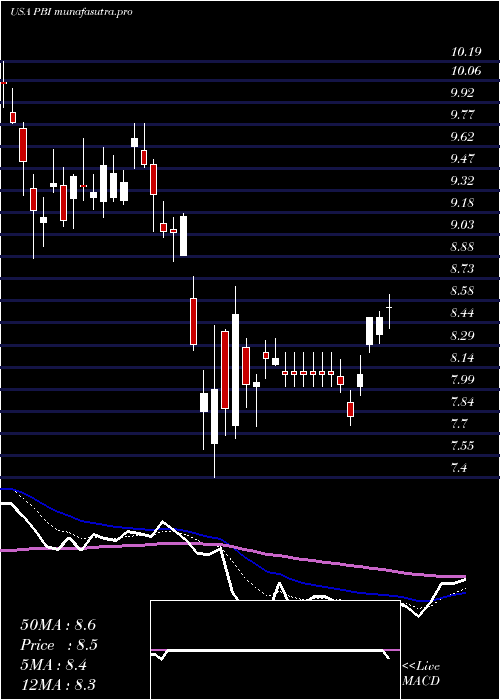
Daily price and charts and targets PitneyBowes Strong Daily Stock price targets for PitneyBowes PBI are 9.73 and 9.91 | Daily Target 1 | 9.69 | | Daily Target 2 | 9.76 | | Daily Target 3 | 9.87 | | Daily Target 4 | 9.94 | | Daily Target 5 | 10.05 |
Daily price and volume Pitney Bowes
| Date |
Closing |
Open |
Range |
Volume |
Thu 04 December 2025 |
9.83 (-0.71%) |
9.94 |
9.80 - 9.98 |
0.9011 times |
Wed 03 December 2025 |
9.90 (4.21%) |
9.72 |
9.63 - 10.08 |
1.6715 times |
Tue 02 December 2025 |
9.50 (-2.96%) |
9.80 |
9.45 - 9.82 |
1.2069 times |
Mon 01 December 2025 |
9.79 (-0.71%) |
9.77 |
9.72 - 9.81 |
1.0737 times |
Fri 28 November 2025 |
9.86 (-0.1%) |
9.88 |
9.79 - 9.92 |
0.4849 times |
Wed 26 November 2025 |
9.87 (-0.3%) |
9.92 |
9.87 - 10.03 |
0.6212 times |
Tue 25 November 2025 |
9.90 (1.85%) |
9.79 |
9.79 - 10.02 |
0.7326 times |
Mon 24 November 2025 |
9.72 (0.93%) |
9.74 |
9.63 - 9.80 |
1.2556 times |
Fri 21 November 2025 |
9.63 (2.56%) |
9.40 |
9.40 - 9.94 |
1.0244 times |
Thu 20 November 2025 |
9.39 (-0.95%) |
9.50 |
9.38 - 9.65 |
1.0282 times |
Wed 19 November 2025 |
9.48 (3.27%) |
9.20 |
9.20 - 9.51 |
0.8921 times |
Weekly price and charts PitneyBowes Strong weekly Stock price targets for PitneyBowes PBI are 9.64 and 10.27 | Weekly Target 1 | 9.16 | | Weekly Target 2 | 9.49 | | Weekly Target 3 | 9.7866666666667 | | Weekly Target 4 | 10.12 | | Weekly Target 5 | 10.42 |
Weekly price and volumes for Pitney Bowes
| Date |
Closing |
Open |
Range |
Volume |
Thu 04 December 2025 |
9.83 (-0.3%) |
9.77 |
9.45 - 10.08 |
1.2345 times |
Fri 28 November 2025 |
9.86 (2.39%) |
9.74 |
9.63 - 10.03 |
0.7871 times |
Fri 21 November 2025 |
9.63 (5.02%) |
9.12 |
8.95 - 9.94 |
1.1792 times |
Fri 14 November 2025 |
9.17 (-2.76%) |
9.35 |
9.07 - 9.57 |
1.1495 times |
Fri 07 November 2025 |
9.43 (-4.55%) |
9.75 |
9.26 - 9.96 |
1.4514 times |
Fri 31 October 2025 |
9.88 (0%) |
10.11 |
9.85 - 10.16 |
0.3886 times |
Fri 31 October 2025 |
9.88 (-16.06%) |
11.79 |
9.85 - 11.98 |
1.7977 times |
Fri 24 October 2025 |
11.77 (4.44%) |
11.29 |
11.24 - 11.96 |
0.845 times |
Fri 17 October 2025 |
11.27 (2.36%) |
11.15 |
10.80 - 11.34 |
0.7317 times |
Tue 07 October 2025 |
11.01 (-0.99%) |
11.24 |
10.82 - 11.24 |
0.4353 times |
Fri 03 October 2025 |
11.12 (-1.42%) |
11.41 |
11.06 - 11.49 |
0.8616 times |
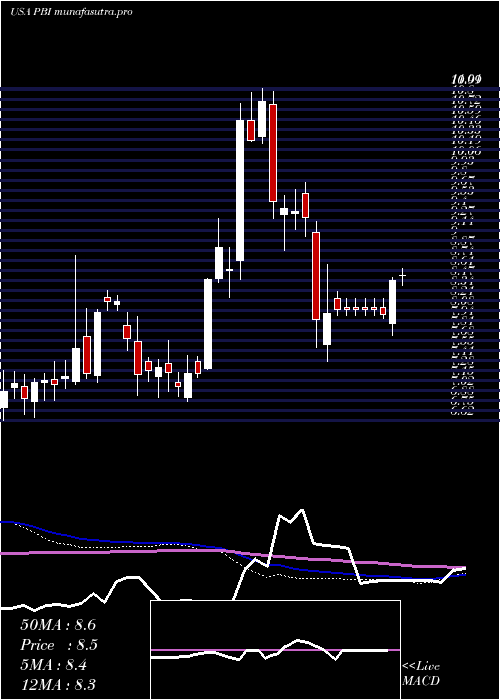
Monthly price and charts PitneyBowes Strong monthly Stock price targets for PitneyBowes PBI are 9.64 and 10.27 | Monthly Target 1 | 9.16 | | Monthly Target 2 | 9.49 | | Monthly Target 3 | 9.7866666666667 | | Monthly Target 4 | 10.12 | | Monthly Target 5 | 10.42 |
Monthly price and volumes Pitney Bowes
| Date |
Closing |
Open |
Range |
Volume |
Thu 04 December 2025 |
9.83 (-0.3%) |
9.77 |
9.45 - 10.08 |
0.2784 times |
Fri 28 November 2025 |
9.86 (-0.2%) |
9.75 |
8.95 - 10.03 |
1.0301 times |
Fri 31 October 2025 |
9.88 (-13.41%) |
11.34 |
9.85 - 11.98 |
1.044 times |
Tue 30 September 2025 |
11.41 (-5.86%) |
11.90 |
11.07 - 12.78 |
1.2386 times |
Fri 29 August 2025 |
12.12 (6.69%) |
11.13 |
10.92 - 12.47 |
1.5537 times |
Thu 31 July 2025 |
11.36 (4.12%) |
10.81 |
10.75 - 13.11 |
1.4325 times |
Mon 30 June 2025 |
10.91 (5.92%) |
10.27 |
9.98 - 11.24 |
0.8292 times |
Fri 30 May 2025 |
10.30 (18.66%) |
8.72 |
8.64 - 10.55 |
0.8909 times |
Wed 30 April 2025 |
8.68 (-4.09%) |
9.06 |
7.40 - 9.17 |
0.8179 times |
Mon 31 March 2025 |
9.05 (-16.44%) |
10.80 |
8.87 - 10.97 |
0.8847 times |
Fri 28 February 2025 |
10.83 (21.55%) |
8.60 |
8.25 - 11.01 |
1.1518 times |

DMA SMA EMA moving averages of Pitney Bowes PBI
DMA (daily moving average) of Pitney Bowes PBI
| DMA period | DMA value | | 5 day DMA | 9.78 | | 12 day DMA | 9.67 | | 20 day DMA | 9.52 | | 35 day DMA | 10.13 | | 50 day DMA | 10.49 | | 100 day DMA | 11.11 | | 150 day DMA | 10.76 | | 200 day DMA | 10.36 | EMA (exponential moving average) of Pitney Bowes PBI
| EMA period | EMA current | EMA prev | EMA prev2 | | 5 day EMA | 9.78 | 9.76 | 9.69 | | 12 day EMA | 9.72 | 9.7 | 9.66 | | 20 day EMA | 9.79 | 9.79 | 9.78 | | 35 day EMA | 10.1 | 10.12 | 10.13 | | 50 day EMA | 10.51 | 10.54 | 10.57 |
SMA (simple moving average) of Pitney Bowes PBI
| SMA period | SMA current | SMA prev | SMA prev2 | | 5 day SMA | 9.78 | 9.78 | 9.78 | | 12 day SMA | 9.67 | 9.6 | 9.54 | | 20 day SMA | 9.52 | 9.5 | 9.48 | | 35 day SMA | 10.13 | 10.17 | 10.2 | | 50 day SMA | 10.49 | 10.53 | 10.57 | | 100 day SMA | 11.11 | 11.13 | 11.14 | | 150 day SMA | 10.76 | 10.75 | 10.74 | | 200 day SMA | 10.36 | 10.36 | 10.36 |
|
|
