PathfinderBancorp PBHC full analysis,charts,indicators,moving averages,SMA,DMA,EMA,ADX,MACD,RSIPathfinder Bancorp PBHC WideScreen charts, DMA,SMA,EMA technical analysis, forecast prediction, by indicators ADX,MACD,RSI,CCI USA stock exchange
operates under Finance sector & deals in Major Banks
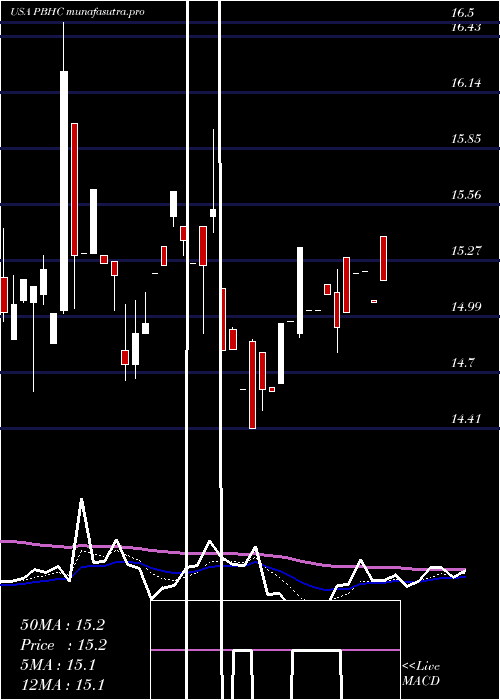
Daily price and charts and targets PathfinderBancorp Strong Daily Stock price targets for PathfinderBancorp PBHC are 15.05 and 15.07 | Daily Target 1 | 15.04 | | Daily Target 2 | 15.05 | | Daily Target 3 | 15.06 | | Daily Target 4 | 15.07 | | Daily Target 5 | 15.08 |
Daily price and volume Pathfinder Bancorp
| Date |
Closing |
Open |
Range |
Volume |
Fri 17 October 2025 |
15.06 (-1.63%) |
15.07 |
15.05 - 15.07 |
0.0917 times |
Thu 16 October 2025 |
15.31 (0.46%) |
15.31 |
15.31 - 15.31 |
8.9806 times |
Wed 15 October 2025 |
15.24 (0.59%) |
15.16 |
15.16 - 15.24 |
0.0612 times |
Tue 14 October 2025 |
15.15 (0.26%) |
15.15 |
15.15 - 15.29 |
0.0815 times |
Mon 13 October 2025 |
15.11 (-0.07%) |
15.08 |
15.08 - 15.11 |
0.0408 times |
Fri 10 October 2025 |
15.12 (-0.92%) |
15.25 |
15.11 - 15.25 |
0.1121 times |
Thu 09 October 2025 |
15.26 (-0.72%) |
15.30 |
15.26 - 15.30 |
0.4587 times |
Wed 08 October 2025 |
15.37 (-0.07%) |
15.37 |
15.37 - 15.37 |
0.0612 times |
Tue 07 October 2025 |
15.38 (-0.77%) |
15.40 |
15.38 - 15.40 |
0.0815 times |
Mon 06 October 2025 |
15.50 (1.31%) |
15.50 |
15.50 - 15.50 |
0.0306 times |
Fri 03 October 2025 |
15.30 (0.53%) |
15.23 |
15.23 - 15.32 |
0.1121 times |
Weekly price and charts PathfinderBancorp Strong weekly Stock price targets for PathfinderBancorp PBHC are 14.93 and 15.19 | Weekly Target 1 | 14.88 | | Weekly Target 2 | 14.97 | | Weekly Target 3 | 15.14 | | Weekly Target 4 | 15.23 | | Weekly Target 5 | 15.4 |
Weekly price and volumes for Pathfinder Bancorp
| Date |
Closing |
Open |
Range |
Volume |
Fri 17 October 2025 |
15.06 (-0.4%) |
15.08 |
15.05 - 15.31 |
3.5408 times |
Fri 10 October 2025 |
15.12 (-1.18%) |
15.50 |
15.11 - 15.50 |
0.2847 times |
Fri 03 October 2025 |
15.30 (-0.13%) |
15.41 |
15.16 - 15.68 |
0.2395 times |
Fri 26 September 2025 |
15.32 (1.46%) |
15.33 |
13.55 - 15.84 |
0.9827 times |
Fri 19 September 2025 |
15.10 (0.8%) |
15.40 |
14.74 - 15.87 |
1.0529 times |
Fri 12 September 2025 |
14.98 (-0.13%) |
14.90 |
14.86 - 15.50 |
1.2167 times |
Fri 05 September 2025 |
15.00 (0.54%) |
14.95 |
14.95 - 15.21 |
1.0568 times |
Fri 29 August 2025 |
14.92 (0%) |
14.92 |
14.92 - 14.92 |
0.0195 times |
Fri 29 August 2025 |
14.92 (1.5%) |
14.97 |
14.70 - 15.46 |
0.815 times |
Fri 22 August 2025 |
14.70 (-2.2%) |
14.67 |
14.40 - 14.85 |
0.7916 times |
Fri 15 August 2025 |
15.03 (3.73%) |
14.49 |
14.29 - 15.03 |
0.2808 times |
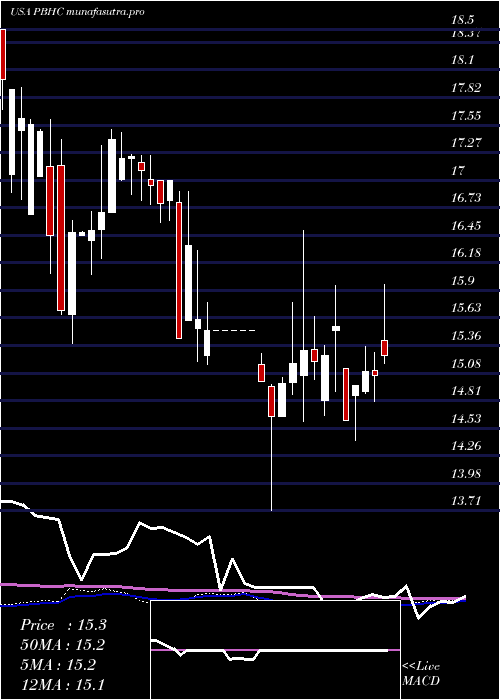
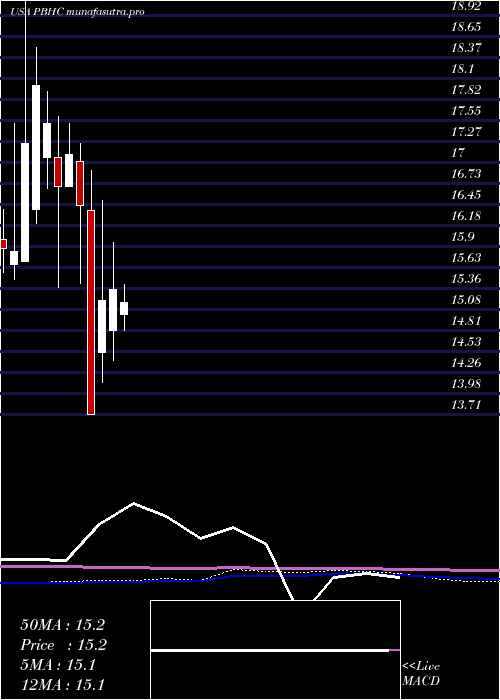
Monthly price and charts PathfinderBancorp Strong monthly Stock price targets for PathfinderBancorp PBHC are 14.76 and 15.36 | Monthly Target 1 | 14.65 | | Monthly Target 2 | 14.86 | | Monthly Target 3 | 15.253333333333 | | Monthly Target 4 | 15.46 | | Monthly Target 5 | 15.85 |
Monthly price and volumes Pathfinder Bancorp
| Date |
Closing |
Open |
Range |
Volume |
Fri 17 October 2025 |
15.06 (-3.95%) |
15.39 |
15.05 - 15.65 |
0.9599 times |
Tue 30 September 2025 |
15.68 (5.09%) |
14.95 |
13.55 - 15.87 |
1.0328 times |
Fri 29 August 2025 |
14.92 (1.98%) |
14.36 |
14.17 - 15.46 |
0.5521 times |
Thu 31 July 2025 |
14.63 (-4.63%) |
15.02 |
14.61 - 15.96 |
0.6227 times |
Mon 30 June 2025 |
15.34 (0.92%) |
14.81 |
14.41 - 15.95 |
0.889 times |
Fri 30 May 2025 |
15.20 (10.87%) |
14.52 |
14.12 - 16.50 |
1.4913 times |
Wed 30 April 2025 |
13.71 (-16.61%) |
16.37 |
13.71 - 16.89 |
0.348 times |
Mon 31 March 2025 |
16.44 (-3.86%) |
17.01 |
15.42 - 17.25 |
0.29 times |
Fri 28 February 2025 |
17.10 (2.52%) |
16.68 |
16.68 - 17.50 |
1.1117 times |
Fri 31 January 2025 |
16.68 (-4.69%) |
17.06 |
15.37 - 17.60 |
2.7024 times |
Tue 31 December 2024 |
17.50 (-2.78%) |
17.06 |
16.66 - 17.92 |
0.2403 times |
DMA SMA EMA moving averages of Pathfinder Bancorp PBHC
DMA (daily moving average) of Pathfinder Bancorp PBHC
| DMA period | DMA value | | 5 day DMA | 15.17 | | 12 day DMA | 15.25 | | 20 day DMA | 15.35 | | 35 day DMA | 15.21 | | 50 day DMA | 15.02 | | 100 day DMA | 15.06 | | 150 day DMA | 15.29 | | 200 day DMA | 15.7 | EMA (exponential moving average) of Pathfinder Bancorp PBHC
| EMA period | EMA current | EMA prev | EMA prev2 | | 5 day EMA | 15.18 | 15.24 | 15.21 | | 12 day EMA | 15.24 | 15.27 | 15.26 | | 20 day EMA | 15.24 | 15.26 | 15.25 | | 35 day EMA | 15.16 | 15.17 | 15.16 | | 50 day EMA | 15.02 | 15.02 | 15.01 |
SMA (simple moving average) of Pathfinder Bancorp PBHC
| SMA period | SMA current | SMA prev | SMA prev2 | | 5 day SMA | 15.17 | 15.19 | 15.18 | | 12 day SMA | 15.25 | 15.28 | 15.31 | | 20 day SMA | 15.35 | 15.35 | 15.34 | | 35 day SMA | 15.21 | 15.2 | 15.18 | | 50 day SMA | 15.02 | 15.01 | 15.01 | | 100 day SMA | 15.06 | 15.06 | 15.06 | | 150 day SMA | 15.29 | 15.3 | 15.31 | | 200 day SMA | 15.7 | 15.72 | 15.73 |
|
|
