PaychexInc PAYX full analysis,charts,indicators,moving averages,SMA,DMA,EMA,ADX,MACD,RSIPaychex Inc PAYX WideScreen charts, DMA,SMA,EMA technical analysis, forecast prediction, by indicators ADX,MACD,RSI,CCI USA stock exchange
operates under Consumer Services sector & deals in Diversified Commercial Services
Daily price and charts and targets PaychexInc Strong Daily Stock price targets for PaychexInc PAYX are 110.09 and 112.95 | Daily Target 1 | 109.53 | | Daily Target 2 | 110.65 | | Daily Target 3 | 112.39333333333 | | Daily Target 4 | 113.51 | | Daily Target 5 | 115.25 |
Daily price and volume Paychex Inc
| Date |
Closing |
Open |
Range |
Volume |
Thu 04 December 2025 |
111.76 (-1.44%) |
113.63 |
111.28 - 114.14 |
0.6383 times |
Wed 03 December 2025 |
113.39 (2.36%) |
110.78 |
110.60 - 113.62 |
1.2688 times |
Tue 02 December 2025 |
110.78 (0.22%) |
110.94 |
109.75 - 111.11 |
1.2032 times |
Mon 01 December 2025 |
110.54 (-1.03%) |
110.83 |
110.23 - 111.77 |
1.5264 times |
Fri 28 November 2025 |
111.69 (0.25%) |
111.40 |
111.24 - 112.23 |
0.3692 times |
Wed 26 November 2025 |
111.41 (-0.62%) |
111.81 |
111.02 - 112.03 |
0.6534 times |
Tue 25 November 2025 |
112.11 (2%) |
110.15 |
109.99 - 112.49 |
0.8399 times |
Mon 24 November 2025 |
109.91 (-1.39%) |
111.26 |
109.42 - 111.57 |
1.6028 times |
Fri 21 November 2025 |
111.46 (2.77%) |
108.43 |
108.43 - 112.95 |
1.2561 times |
Thu 20 November 2025 |
108.46 (-0.99%) |
109.72 |
108.12 - 109.99 |
0.6418 times |
Wed 19 November 2025 |
109.55 (-0.37%) |
109.92 |
108.00 - 110.07 |
0.6843 times |
Weekly price and charts PaychexInc Strong weekly Stock price targets for PaychexInc PAYX are 110.76 and 115.15 | Weekly Target 1 | 107.49 | | Weekly Target 2 | 109.63 | | Weekly Target 3 | 111.88333333333 | | Weekly Target 4 | 114.02 | | Weekly Target 5 | 116.27 |
Weekly price and volumes for Paychex Inc
| Date |
Closing |
Open |
Range |
Volume |
Thu 04 December 2025 |
111.76 (0.06%) |
110.83 |
109.75 - 114.14 |
1.2586 times |
Fri 28 November 2025 |
111.69 (0.21%) |
111.26 |
109.42 - 112.49 |
0.9406 times |
Fri 21 November 2025 |
111.46 (-0.57%) |
111.87 |
108.00 - 112.95 |
0.9747 times |
Fri 14 November 2025 |
112.10 (0.13%) |
112.05 |
109.99 - 112.65 |
1.0231 times |
Fri 07 November 2025 |
111.96 (-4.33%) |
116.17 |
110.70 - 117.03 |
1.1672 times |
Fri 31 October 2025 |
117.03 (0%) |
116.82 |
116.08 - 118.01 |
0.2217 times |
Fri 31 October 2025 |
117.03 (-6.08%) |
124.59 |
116.08 - 125.29 |
1.2524 times |
Fri 24 October 2025 |
124.60 (-1.55%) |
126.75 |
124.21 - 128.78 |
1.0799 times |
Fri 17 October 2025 |
126.56 (0.8%) |
125.69 |
125.25 - 129.24 |
1.0608 times |
Fri 10 October 2025 |
125.55 (0.75%) |
124.96 |
123.26 - 127.14 |
1.0209 times |
Fri 03 October 2025 |
124.61 (-2.81%) |
128.60 |
119.02 - 130.32 |
1.6234 times |
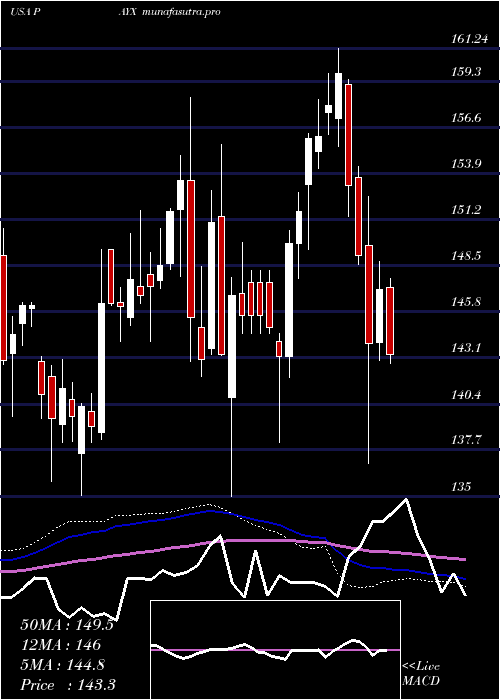
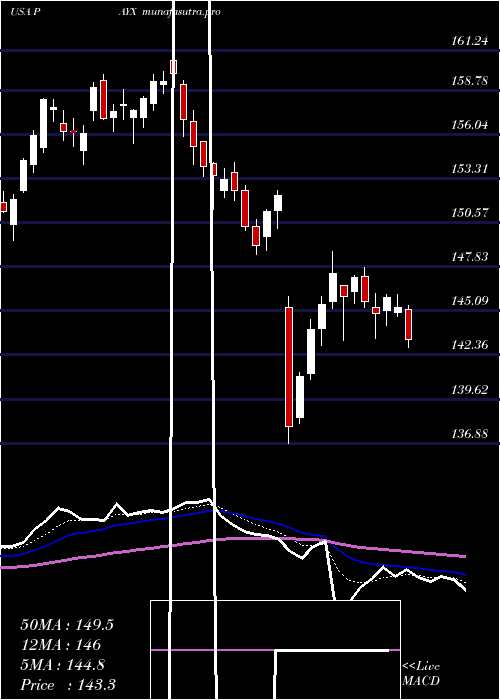
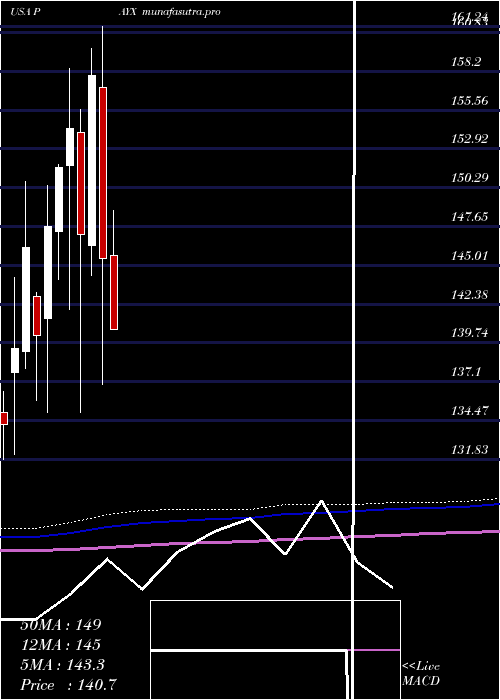
Monthly price and charts PaychexInc Strong monthly Stock price targets for PaychexInc PAYX are 110.76 and 115.15 | Monthly Target 1 | 107.49 | | Monthly Target 2 | 109.63 | | Monthly Target 3 | 111.88333333333 | | Monthly Target 4 | 114.02 | | Monthly Target 5 | 116.27 |
Monthly price and volumes Paychex Inc
| Date |
Closing |
Open |
Range |
Volume |
Thu 04 December 2025 |
111.76 (0.06%) |
110.83 |
109.75 - 114.14 |
0.3349 times |
Fri 28 November 2025 |
111.69 (-4.56%) |
116.17 |
108.00 - 117.03 |
1.0924 times |
Fri 31 October 2025 |
117.03 (-7.68%) |
126.76 |
116.08 - 129.24 |
1.4169 times |
Tue 30 September 2025 |
126.76 (-9.11%) |
138.69 |
119.02 - 139.06 |
1.4204 times |
Fri 29 August 2025 |
139.46 (-3.37%) |
143.12 |
134.81 - 143.58 |
0.9816 times |
Thu 31 July 2025 |
144.33 (-0.78%) |
145.69 |
140.22 - 148.76 |
1.03 times |
Mon 30 June 2025 |
145.46 (-7.88%) |
157.10 |
136.88 - 161.24 |
1.0805 times |
Fri 30 May 2025 |
157.91 (7.33%) |
146.34 |
144.30 - 159.75 |
0.678 times |
Wed 30 April 2025 |
147.12 (-4.64%) |
154.07 |
135.00 - 155.58 |
1.018 times |
Mon 31 March 2025 |
154.28 (1.72%) |
151.77 |
142.01 - 158.37 |
0.9473 times |
Fri 28 February 2025 |
151.67 (2.71%) |
147.27 |
144.07 - 151.86 |
0.6511 times |
DMA SMA EMA moving averages of Paychex Inc PAYX
DMA (daily moving average) of Paychex Inc PAYX
| DMA period | DMA value | | 5 day DMA | 111.63 | | 12 day DMA | 110.92 | | 20 day DMA | 111.22 | | 35 day DMA | 115.91 | | 50 day DMA | 119.03 | | 100 day DMA | 128.69 | | 150 day DMA | 136.27 | | 200 day DMA | 139.09 | EMA (exponential moving average) of Paychex Inc PAYX
| EMA period | EMA current | EMA prev | EMA prev2 | | 5 day EMA | 111.76 | 111.76 | 110.94 | | 12 day EMA | 111.68 | 111.67 | 111.36 | | 20 day EMA | 112.71 | 112.81 | 112.75 | | 35 day EMA | 115.62 | 115.85 | 115.99 | | 50 day EMA | 119.18 | 119.48 | 119.73 |
SMA (simple moving average) of Paychex Inc PAYX
| SMA period | SMA current | SMA prev | SMA prev2 | | 5 day SMA | 111.63 | 111.56 | 111.31 | | 12 day SMA | 110.92 | 110.81 | 110.7 | | 20 day SMA | 111.22 | 111.46 | 111.54 | | 35 day SMA | 115.91 | 116.36 | 116.8 | | 50 day SMA | 119.03 | 119.36 | 119.68 | | 100 day SMA | 128.69 | 128.98 | 129.29 | | 150 day SMA | 136.27 | 136.5 | 136.72 | | 200 day SMA | 139.09 | 139.27 | 139.44 |
|
|
