PaycomSoftware PAYC full analysis,charts,indicators,moving averages,SMA,DMA,EMA,ADX,MACD,RSIPaycom Software PAYC WideScreen charts, DMA,SMA,EMA technical analysis, forecast prediction, by indicators ADX,MACD,RSI,CCI USA stock exchange
operates under Technology sector & deals in Computer Software Prepackaged Software
Daily price and charts and targets PaycomSoftware Strong Daily Stock price targets for PaycomSoftware PAYC are 200.55 and 203.79 | Daily Target 1 | 198.2 | | Daily Target 2 | 199.65 | | Daily Target 3 | 201.44333333333 | | Daily Target 4 | 202.89 | | Daily Target 5 | 204.68 |
Daily price and volume Paycom Software
| Date |
Closing |
Open |
Range |
Volume |
Mon 20 October 2025 |
201.09 (0.2%) |
200.69 |
200.00 - 203.24 |
0.8012 times |
Fri 17 October 2025 |
200.69 (0.1%) |
200.28 |
198.13 - 202.43 |
0.8228 times |
Thu 16 October 2025 |
200.49 (0.5%) |
200.48 |
198.51 - 201.57 |
1.1829 times |
Wed 15 October 2025 |
199.50 (-0.51%) |
202.05 |
199.50 - 202.57 |
0.973 times |
Tue 14 October 2025 |
200.53 (-0.38%) |
199.48 |
199.48 - 203.06 |
0.9736 times |
Mon 13 October 2025 |
201.30 (0.74%) |
198.82 |
197.73 - 202.24 |
0.7509 times |
Fri 10 October 2025 |
199.82 (-1.37%) |
203.04 |
199.63 - 203.62 |
0.9042 times |
Thu 09 October 2025 |
202.59 (-1.21%) |
206.27 |
202.36 - 206.39 |
1.1983 times |
Wed 08 October 2025 |
205.08 (0.67%) |
203.76 |
201.99 - 206.49 |
0.9653 times |
Tue 07 October 2025 |
203.71 (1.74%) |
201.10 |
199.50 - 203.99 |
1.4277 times |
Mon 06 October 2025 |
200.22 (-0.81%) |
203.33 |
199.59 - 204.02 |
1.1784 times |
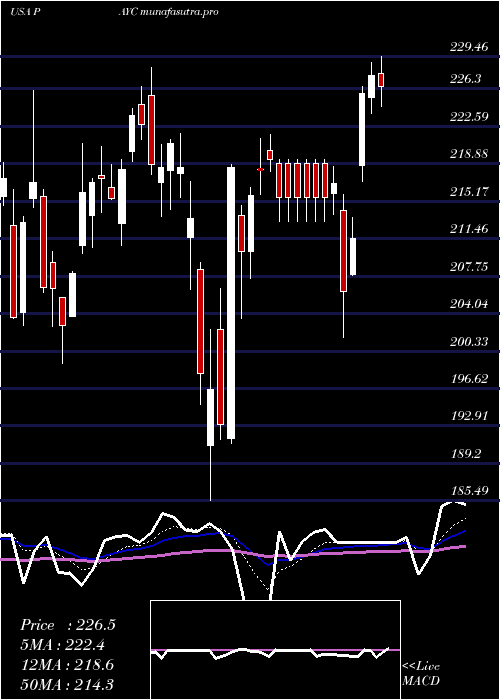
Weekly price and charts PaycomSoftware Strong weekly Stock price targets for PaycomSoftware PAYC are 200.55 and 203.79 | Weekly Target 1 | 198.2 | | Weekly Target 2 | 199.65 | | Weekly Target 3 | 201.44333333333 | | Weekly Target 4 | 202.89 | | Weekly Target 5 | 204.68 |
Weekly price and volumes for Paycom Software
| Date |
Closing |
Open |
Range |
Volume |
Mon 20 October 2025 |
201.09 (0.2%) |
200.69 |
200.00 - 203.24 |
0.165 times |
Fri 17 October 2025 |
200.69 (0.44%) |
198.82 |
197.73 - 203.06 |
0.9685 times |
Fri 10 October 2025 |
199.82 (-1.01%) |
203.33 |
199.50 - 206.49 |
1.1684 times |
Fri 03 October 2025 |
201.86 (-7.2%) |
217.89 |
198.20 - 218.75 |
1.7923 times |
Fri 26 September 2025 |
217.51 (0.42%) |
215.70 |
213.81 - 222.36 |
1.2061 times |
Fri 19 September 2025 |
216.60 (-2.71%) |
222.84 |
210.51 - 223.65 |
1.5923 times |
Fri 12 September 2025 |
222.63 (-0.66%) |
223.39 |
219.22 - 227.49 |
0.9319 times |
Fri 05 September 2025 |
224.12 (-1.33%) |
224.02 |
216.21 - 227.30 |
1.0683 times |
Fri 29 August 2025 |
227.15 (0%) |
225.79 |
225.34 - 227.57 |
0.1288 times |
Fri 29 August 2025 |
227.15 (-2.88%) |
232.98 |
225.34 - 234.60 |
0.9784 times |
Fri 22 August 2025 |
233.89 (7.69%) |
221.55 |
221.55 - 234.28 |
1.2473 times |
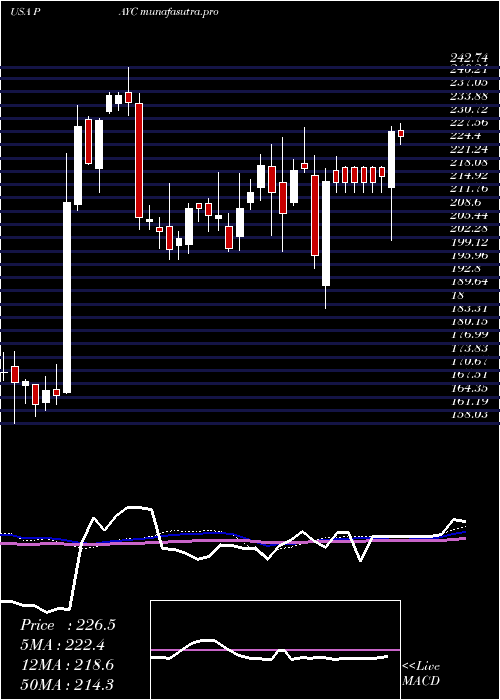
Monthly price and charts PaycomSoftware Strong monthly Stock price targets for PaycomSoftware PAYC are 194.03 and 204.8 | Monthly Target 1 | 191.67 | | Monthly Target 2 | 196.38 | | Monthly Target 3 | 202.44 | | Monthly Target 4 | 207.15 | | Monthly Target 5 | 213.21 |
Monthly price and volumes Paycom Software
| Date |
Closing |
Open |
Range |
Volume |
Mon 20 October 2025 |
201.09 (-3.39%) |
208.50 |
197.73 - 208.50 |
0.7379 times |
Tue 30 September 2025 |
208.14 (-8.37%) |
224.02 |
207.18 - 227.49 |
1.1428 times |
Fri 29 August 2025 |
227.15 (-1.9%) |
231.12 |
213.55 - 248.95 |
1.163 times |
Thu 31 July 2025 |
231.54 (0.06%) |
230.10 |
218.00 - 240.14 |
0.8932 times |
Mon 30 June 2025 |
231.40 (-10.69%) |
259.09 |
221.15 - 267.76 |
1.0125 times |
Fri 30 May 2025 |
259.09 (14.44%) |
227.72 |
223.36 - 262.80 |
0.9973 times |
Wed 30 April 2025 |
226.39 (3.62%) |
218.25 |
185.49 - 229.75 |
0.9357 times |
Mon 31 March 2025 |
218.48 (-0.45%) |
219.14 |
199.14 - 228.45 |
1.2444 times |
Fri 28 February 2025 |
219.47 (5.74%) |
204.95 |
199.11 - 222.10 |
1.0509 times |
Fri 31 January 2025 |
207.56 (1.26%) |
207.00 |
197.12 - 217.93 |
0.8225 times |
Tue 31 December 2024 |
204.97 (-13.24%) |
236.77 |
201.10 - 242.74 |
0.7721 times |

DMA SMA EMA moving averages of Paycom Software PAYC
DMA (daily moving average) of Paycom Software PAYC
| DMA period | DMA value | | 5 day DMA | 200.46 | | 12 day DMA | 201.41 | | 20 day DMA | 205.66 | | 35 day DMA | 211.98 | | 50 day DMA | 215.87 | | 100 day DMA | 226.66 | | 150 day DMA | 227.18 | | 200 day DMA | 222.73 | EMA (exponential moving average) of Paycom Software PAYC
| EMA period | EMA current | EMA prev | EMA prev2 | | 5 day EMA | 200.84 | 200.71 | 200.72 | | 12 day EMA | 202.52 | 202.78 | 203.16 | | 20 day EMA | 205.36 | 205.81 | 206.35 | | 35 day EMA | 210.08 | 210.61 | 211.19 | | 50 day EMA | 215.18 | 215.76 | 216.37 |
SMA (simple moving average) of Paycom Software PAYC
| SMA period | SMA current | SMA prev | SMA prev2 | | 5 day SMA | 200.46 | 200.5 | 200.33 | | 12 day SMA | 201.41 | 201.43 | 201.31 | | 20 day SMA | 205.66 | 206.61 | 207.41 | | 35 day SMA | 211.98 | 212.73 | 213.48 | | 50 day SMA | 215.87 | 216.26 | 216.85 | | 100 day SMA | 226.66 | 227.26 | 227.84 | | 150 day SMA | 227.18 | 227.29 | 227.39 | | 200 day SMA | 222.73 | 222.76 | 222.78 |
|
|
