PatrickIndustries PATK full analysis,charts,indicators,moving averages,SMA,DMA,EMA,ADX,MACD,RSIPatrick Industries PATK WideScreen charts, DMA,SMA,EMA technical analysis, forecast prediction, by indicators ADX,MACD,RSI,CCI USA stock exchange
operates under Basic Industries sector & deals in Forest Products
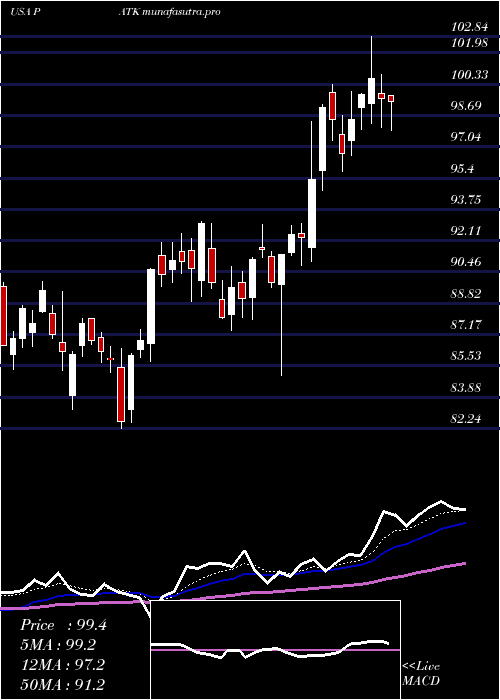
Daily price and charts and targets PatrickIndustries Strong Daily Stock price targets for PatrickIndustries PATK are 97.94 and 101.07 | Daily Target 1 | 95.42 | | Daily Target 2 | 97.32 | | Daily Target 3 | 98.553333333333 | | Daily Target 4 | 100.45 | | Daily Target 5 | 101.68 |
Daily price and volume Patrick Industries
| Date |
Closing |
Open |
Range |
Volume |
Tue 21 October 2025 |
99.21 (1.89%) |
97.53 |
96.66 - 99.79 |
1.0475 times |
Mon 20 October 2025 |
97.37 (-0.27%) |
98.64 |
96.76 - 99.76 |
0.9909 times |
Fri 17 October 2025 |
97.63 (-1.37%) |
98.99 |
97.54 - 99.94 |
1.2621 times |
Thu 16 October 2025 |
98.99 (-0.53%) |
99.81 |
97.83 - 99.81 |
0.6913 times |
Wed 15 October 2025 |
99.52 (0.3%) |
99.97 |
98.80 - 101.38 |
0.8074 times |
Tue 14 October 2025 |
99.22 (2.33%) |
96.29 |
95.91 - 99.80 |
1.0285 times |
Mon 13 October 2025 |
96.96 (-0.32%) |
97.91 |
96.70 - 99.19 |
0.8034 times |
Fri 10 October 2025 |
97.27 (0.09%) |
97.77 |
96.49 - 98.70 |
1.3276 times |
Thu 09 October 2025 |
97.18 (-1.28%) |
98.05 |
96.43 - 98.53 |
1.2526 times |
Wed 08 October 2025 |
98.44 (-1.25%) |
99.73 |
98.24 - 100.40 |
0.7889 times |
Tue 07 October 2025 |
99.69 (-0.31%) |
100.03 |
98.81 - 101.41 |
1.3191 times |
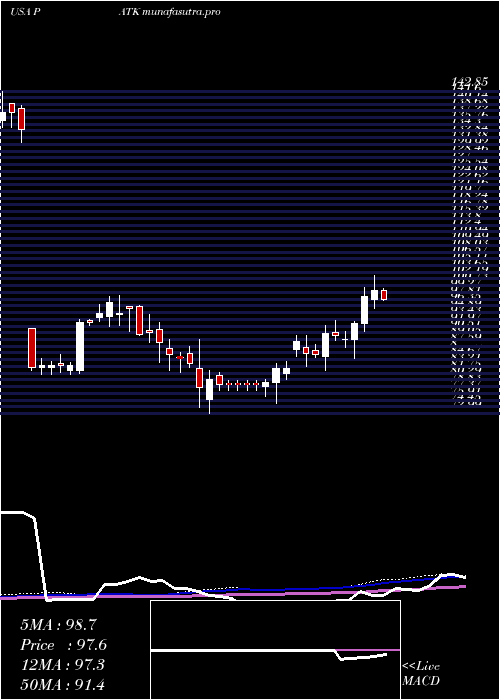
Weekly price and charts PatrickIndustries Strong weekly Stock price targets for PatrickIndustries PATK are 97.94 and 101.07 | Weekly Target 1 | 95.42 | | Weekly Target 2 | 97.32 | | Weekly Target 3 | 98.553333333333 | | Weekly Target 4 | 100.45 | | Weekly Target 5 | 101.68 |
Weekly price and volumes for Patrick Industries
| Date |
Closing |
Open |
Range |
Volume |
Tue 21 October 2025 |
99.21 (1.62%) |
98.64 |
96.66 - 99.79 |
0.4118 times |
Fri 17 October 2025 |
97.63 (0.37%) |
97.91 |
95.91 - 101.38 |
0.9279 times |
Fri 10 October 2025 |
97.27 (-6.33%) |
104.04 |
96.43 - 106.01 |
1.2377 times |
Fri 03 October 2025 |
103.84 (0.23%) |
103.80 |
101.46 - 106.81 |
1.1288 times |
Fri 26 September 2025 |
103.60 (-2.28%) |
105.85 |
101.86 - 107.91 |
1.0169 times |
Fri 19 September 2025 |
106.02 (-3.94%) |
110.57 |
105.17 - 111.32 |
1.9923 times |
Fri 12 September 2025 |
110.37 (-2.81%) |
113.70 |
110.00 - 114.10 |
0.8882 times |
Fri 05 September 2025 |
113.56 (1.53%) |
110.53 |
109.27 - 116.22 |
1.0583 times |
Fri 29 August 2025 |
111.85 (0%) |
113.04 |
111.57 - 113.24 |
0.1987 times |
Fri 29 August 2025 |
111.85 (-3.61%) |
114.83 |
110.50 - 115.86 |
1.1394 times |
Fri 22 August 2025 |
116.04 (3.49%) |
112.01 |
109.00 - 116.78 |
1.2754 times |
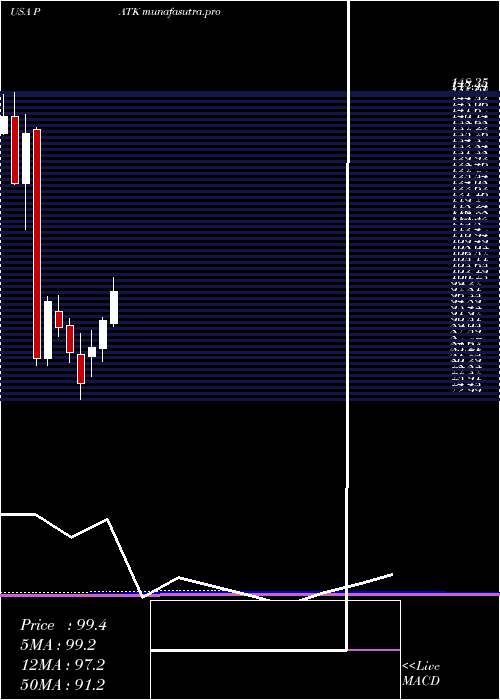
Monthly price and charts PatrickIndustries Strong monthly Stock price targets for PatrickIndustries PATK are 92.22 and 102.91 | Monthly Target 1 | 89.88 | | Monthly Target 2 | 94.55 | | Monthly Target 3 | 100.57333333333 | | Monthly Target 4 | 105.24 | | Monthly Target 5 | 111.26 |
Monthly price and volumes Patrick Industries
| Date |
Closing |
Open |
Range |
Volume |
Tue 21 October 2025 |
99.21 (-4.08%) |
102.81 |
95.91 - 106.60 |
0.4862 times |
Tue 30 September 2025 |
103.43 (-7.53%) |
110.53 |
101.86 - 116.22 |
0.8093 times |
Fri 29 August 2025 |
111.85 (15.02%) |
98.95 |
95.60 - 116.78 |
1.0473 times |
Thu 31 July 2025 |
97.24 (5.39%) |
91.73 |
91.02 - 103.25 |
1.0784 times |
Mon 30 June 2025 |
92.27 (7.47%) |
85.44 |
82.24 - 93.12 |
0.8663 times |
Fri 30 May 2025 |
85.86 (11.54%) |
83.66 |
78.60 - 89.97 |
0.96 times |
Wed 30 April 2025 |
76.98 (-8.96%) |
84.10 |
72.99 - 89.13 |
1.3742 times |
Mon 31 March 2025 |
84.56 (-6.67%) |
91.24 |
82.00 - 92.80 |
1.1243 times |
Fri 28 February 2025 |
90.60 (-6.73%) |
94.50 |
88.51 - 98.60 |
1.0529 times |
Fri 31 January 2025 |
97.14 (16.92%) |
83.08 |
81.47 - 98.37 |
1.2011 times |
Tue 31 December 2024 |
83.08 (-39.95%) |
139.12 |
81.42 - 139.79 |
1.0434 times |
DMA SMA EMA moving averages of Patrick Industries PATK
DMA (daily moving average) of Patrick Industries PATK
| DMA period | DMA value | | 5 day DMA | 98.54 | | 12 day DMA | 98.46 | | 20 day DMA | 100.47 | | 35 day DMA | 104.52 | | 50 day DMA | 106.95 | | 100 day DMA | 101.1 | | 150 day DMA | 94.97 | | 200 day DMA | 93.96 | EMA (exponential moving average) of Patrick Industries PATK
| EMA period | EMA current | EMA prev | EMA prev2 | | 5 day EMA | 98.47 | 98.1 | 98.46 | | 12 day EMA | 99.26 | 99.27 | 99.61 | | 20 day EMA | 100.69 | 100.85 | 101.22 | | 35 day EMA | 103.07 | 103.3 | 103.65 | | 50 day EMA | 105.79 | 106.06 | 106.41 |
SMA (simple moving average) of Patrick Industries PATK
| SMA period | SMA current | SMA prev | SMA prev2 | | 5 day SMA | 98.54 | 98.55 | 98.46 | | 12 day SMA | 98.46 | 98.84 | 99.41 | | 20 day SMA | 100.47 | 100.79 | 101.19 | | 35 day SMA | 104.52 | 104.85 | 105.27 | | 50 day SMA | 106.95 | 107.13 | 107.25 | | 100 day SMA | 101.1 | 100.98 | 100.88 | | 150 day SMA | 94.97 | 94.87 | 94.79 | | 200 day SMA | 93.96 | 93.88 | 93.8 |
|
|
