PampaEnergia PAM full analysis,charts,indicators,moving averages,SMA,DMA,EMA,ADX,MACD,RSIPampa Energia PAM WideScreen charts, DMA,SMA,EMA technical analysis, forecast prediction, by indicators ADX,MACD,RSI,CCI USA stock exchange
operates under Public Utilities sector & deals in Electric Utilities Central
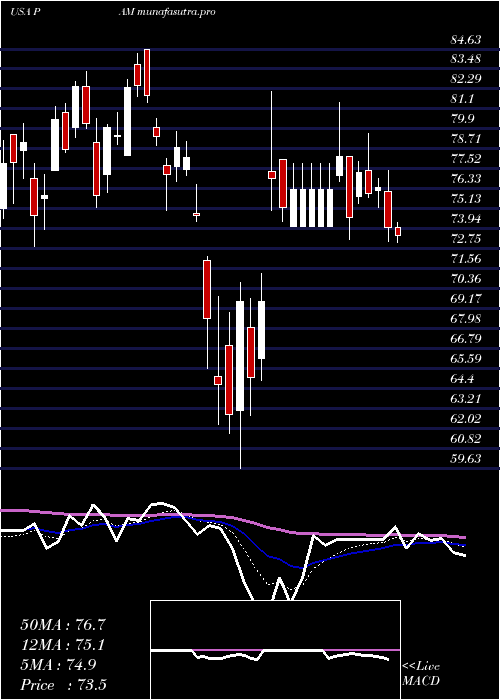
Daily price and charts and targets PampaEnergia Strong Daily Stock price targets for PampaEnergia PAM are 88.95 and 92.78 | Daily Target 1 | 88.22 | | Daily Target 2 | 89.68 | | Daily Target 3 | 92.046666666667 | | Daily Target 4 | 93.51 | | Daily Target 5 | 95.88 |
Daily price and volume Pampa Energia
| Date |
Closing |
Open |
Range |
Volume |
Thu 04 December 2025 |
91.15 (-1.21%) |
94.00 |
90.58 - 94.41 |
0.8836 times |
Wed 03 December 2025 |
92.27 (3.26%) |
89.63 |
89.63 - 93.33 |
0.883 times |
Tue 02 December 2025 |
89.36 (-0.94%) |
90.30 |
89.01 - 91.50 |
1.1759 times |
Mon 01 December 2025 |
90.21 (-0.51%) |
89.20 |
89.04 - 90.88 |
1.0659 times |
Fri 28 November 2025 |
90.67 (2.13%) |
90.00 |
89.08 - 91.02 |
0.6892 times |
Wed 26 November 2025 |
88.78 (3.4%) |
87.50 |
87.29 - 89.64 |
1.0319 times |
Tue 25 November 2025 |
85.86 (-0.5%) |
85.21 |
83.48 - 87.27 |
1.1146 times |
Mon 24 November 2025 |
86.29 (1.05%) |
84.57 |
82.87 - 86.41 |
1.0198 times |
Fri 21 November 2025 |
85.39 (-2.34%) |
86.69 |
83.04 - 87.00 |
1.1395 times |
Thu 20 November 2025 |
87.44 (-2.09%) |
90.50 |
86.33 - 90.63 |
0.9967 times |
Wed 19 November 2025 |
89.31 (0.48%) |
88.95 |
88.60 - 92.20 |
1.4494 times |
Weekly price and charts PampaEnergia Strong weekly Stock price targets for PampaEnergia PAM are 90.08 and 95.48 | Weekly Target 1 | 86.12 | | Weekly Target 2 | 88.64 | | Weekly Target 3 | 91.523333333333 | | Weekly Target 4 | 94.04 | | Weekly Target 5 | 96.92 |
Weekly price and volumes for Pampa Energia
| Date |
Closing |
Open |
Range |
Volume |
Thu 04 December 2025 |
91.15 (0.53%) |
89.20 |
89.01 - 94.41 |
0.4662 times |
Fri 28 November 2025 |
90.67 (6.18%) |
84.57 |
82.87 - 91.02 |
0.4484 times |
Fri 21 November 2025 |
85.39 (-5.2%) |
90.23 |
83.04 - 92.20 |
0.7171 times |
Fri 14 November 2025 |
90.07 (4.12%) |
88.89 |
84.58 - 91.03 |
0.9391 times |
Fri 07 November 2025 |
86.51 (0.83%) |
88.70 |
82.74 - 90.00 |
1.0128 times |
Fri 31 October 2025 |
85.80 (0%) |
81.76 |
81.76 - 88.37 |
0.4768 times |
Fri 31 October 2025 |
85.80 (37.02%) |
81.37 |
74.02 - 88.37 |
3.107 times |
Fri 24 October 2025 |
62.62 (-1.53%) |
63.34 |
58.50 - 64.80 |
1.3234 times |
Fri 17 October 2025 |
63.59 (6%) |
64.50 |
62.59 - 69.88 |
1.316 times |
Tue 07 October 2025 |
59.99 (-1.33%) |
61.00 |
59.15 - 61.60 |
0.1931 times |
Fri 03 October 2025 |
60.80 (-1.75%) |
62.01 |
57.14 - 62.57 |
1.3046 times |
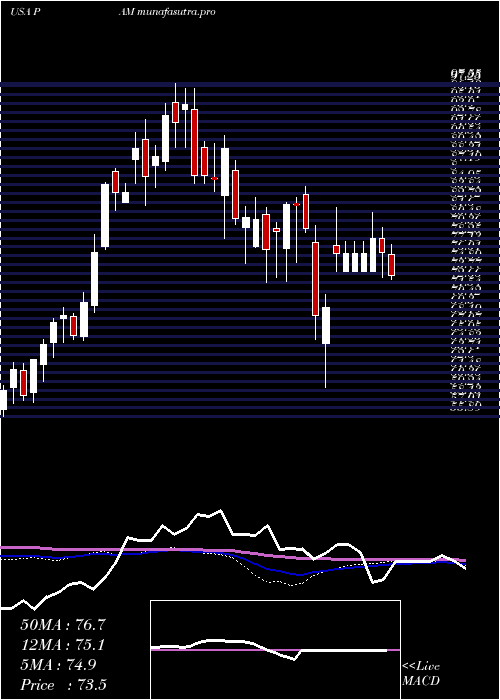
Monthly price and charts PampaEnergia Strong monthly Stock price targets for PampaEnergia PAM are 90.08 and 95.48 | Monthly Target 1 | 86.12 | | Monthly Target 2 | 88.64 | | Monthly Target 3 | 91.523333333333 | | Monthly Target 4 | 94.04 | | Monthly Target 5 | 96.92 |
Monthly price and volumes Pampa Energia
| Date |
Closing |
Open |
Range |
Volume |
Thu 04 December 2025 |
91.15 (0.53%) |
89.20 |
89.01 - 94.41 |
0.1256 times |
Fri 28 November 2025 |
90.67 (5.68%) |
88.70 |
82.74 - 92.20 |
0.8399 times |
Fri 31 October 2025 |
85.80 (42.86%) |
60.00 |
57.14 - 88.37 |
1.9275 times |
Tue 30 September 2025 |
60.06 (-11.06%) |
66.33 |
54.95 - 69.60 |
2.014 times |
Fri 29 August 2025 |
67.53 (-11.2%) |
75.70 |
65.38 - 83.10 |
1.0795 times |
Thu 31 July 2025 |
76.05 (9.61%) |
69.10 |
67.15 - 80.00 |
0.9951 times |
Mon 30 June 2025 |
69.38 (-9.51%) |
76.95 |
67.72 - 78.05 |
0.6006 times |
Fri 30 May 2025 |
76.67 (8%) |
71.18 |
68.00 - 87.59 |
0.7932 times |
Wed 30 April 2025 |
70.99 (-8.04%) |
77.66 |
59.63 - 82.11 |
0.9493 times |
Mon 31 March 2025 |
77.20 (0.51%) |
79.47 |
72.86 - 84.63 |
0.6752 times |
Fri 28 February 2025 |
76.81 (-14.11%) |
86.67 |
72.68 - 87.91 |
0.9256 times |

DMA SMA EMA moving averages of Pampa Energia PAM
DMA (daily moving average) of Pampa Energia PAM
| DMA period | DMA value | | 5 day DMA | 90.73 | | 12 day DMA | 88.8 | | 20 day DMA | 88.4 | | 35 day DMA | 81.91 | | 50 day DMA | 76.11 | | 100 day DMA | 72.85 | | 150 day DMA | 73.56 | | 200 day DMA | 74.34 | EMA (exponential moving average) of Pampa Energia PAM
| EMA period | EMA current | EMA prev | EMA prev2 | | 5 day EMA | 90.5 | 90.18 | 89.14 | | 12 day EMA | 89.05 | 88.67 | 88.02 | | 20 day EMA | 86.99 | 86.55 | 85.95 | | 35 day EMA | 81.7 | 81.14 | 80.49 | | 50 day EMA | 76.17 | 75.56 | 74.88 |
SMA (simple moving average) of Pampa Energia PAM
| SMA period | SMA current | SMA prev | SMA prev2 | | 5 day SMA | 90.73 | 90.26 | 88.98 | | 12 day SMA | 88.8 | 88.52 | 88.34 | | 20 day SMA | 88.4 | 88.21 | 87.97 | | 35 day SMA | 81.91 | 81.19 | 80.38 | | 50 day SMA | 76.11 | 75.44 | 74.72 | | 100 day SMA | 72.85 | 72.64 | 72.43 | | 150 day SMA | 73.56 | 73.46 | 73.35 | | 200 day SMA | 74.34 | 74.29 | 74.22 |
|
|
