WesternAsset PAI full analysis,charts,indicators,moving averages,SMA,DMA,EMA,ADX,MACD,RSIWestern Asset PAI WideScreen charts, DMA,SMA,EMA technical analysis, forecast prediction, by indicators ADX,MACD,RSI,CCI USA stock exchange
operates under N A sector & deals in N A
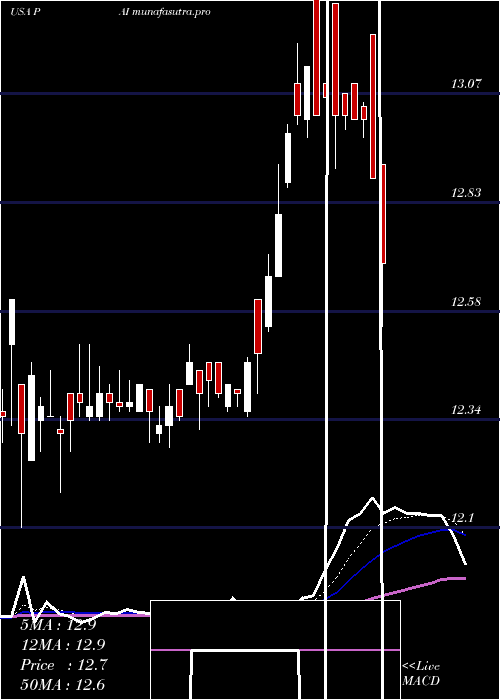
Daily price and charts and targets WesternAsset Strong Daily Stock price targets for WesternAsset PAI are 12.4 and 12.46 | Daily Target 1 | 12.37 | | Daily Target 2 | 12.4 | | Daily Target 3 | 12.43 | | Daily Target 4 | 12.46 | | Daily Target 5 | 12.49 |
Daily price and volume Western Asset
| Date |
Closing |
Open |
Range |
Volume |
Thu 04 December 2025 |
12.43 (0.24%) |
12.43 |
12.40 - 12.46 |
1.5735 times |
Wed 03 December 2025 |
12.40 (0.16%) |
12.37 |
12.37 - 12.49 |
1.1812 times |
Tue 02 December 2025 |
12.38 (-0.4%) |
12.45 |
12.38 - 12.47 |
0.7935 times |
Mon 01 December 2025 |
12.43 (-0.32%) |
12.43 |
12.37 - 12.44 |
0.3787 times |
Fri 28 November 2025 |
12.47 (0.24%) |
12.47 |
12.42 - 12.53 |
0.7484 times |
Wed 26 November 2025 |
12.44 (0.08%) |
12.40 |
12.34 - 12.46 |
0.8837 times |
Tue 25 November 2025 |
12.43 (0.49%) |
12.39 |
12.33 - 12.43 |
0.6853 times |
Mon 24 November 2025 |
12.37 (0.41%) |
12.32 |
12.32 - 12.43 |
0.3922 times |
Fri 21 November 2025 |
12.32 (0.24%) |
12.34 |
12.30 - 12.38 |
1.2624 times |
Thu 20 November 2025 |
12.29 (-0.97%) |
12.41 |
12.28 - 12.43 |
2.101 times |
Wed 19 November 2025 |
12.41 (-0.24%) |
12.44 |
12.39 - 12.52 |
0.2299 times |
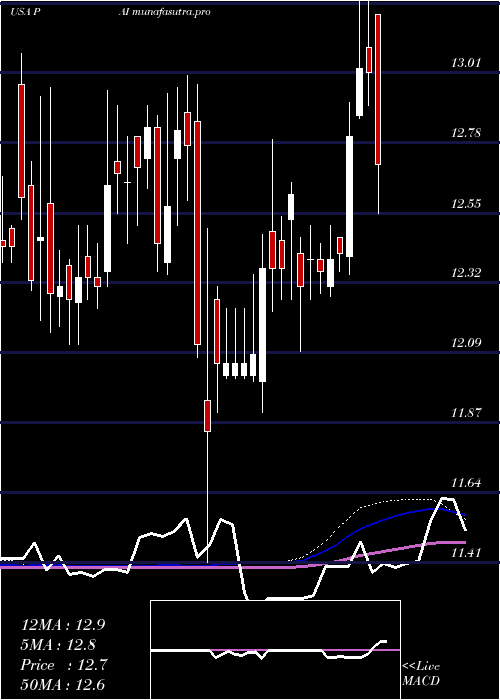
Weekly price and charts WesternAsset Strong weekly Stock price targets for WesternAsset PAI are 12.37 and 12.49 | Weekly Target 1 | 12.31 | | Weekly Target 2 | 12.37 | | Weekly Target 3 | 12.43 | | Weekly Target 4 | 12.49 | | Weekly Target 5 | 12.55 |
Weekly price and volumes for Western Asset
| Date |
Closing |
Open |
Range |
Volume |
Thu 04 December 2025 |
12.43 (-0.32%) |
12.43 |
12.37 - 12.49 |
0.6995 times |
Fri 28 November 2025 |
12.47 (1.22%) |
12.32 |
12.32 - 12.53 |
0.4827 times |
Fri 21 November 2025 |
12.32 (-1.12%) |
12.51 |
12.28 - 12.53 |
0.8778 times |
Fri 14 November 2025 |
12.46 (0.08%) |
12.49 |
12.41 - 12.55 |
0.9171 times |
Fri 07 November 2025 |
12.45 (-0.95%) |
12.52 |
12.40 - 12.58 |
0.8778 times |
Fri 31 October 2025 |
12.57 (0%) |
12.58 |
12.52 - 12.59 |
0.1108 times |
Fri 31 October 2025 |
12.57 (-0.71%) |
12.70 |
12.50 - 12.70 |
2.0021 times |
Fri 24 October 2025 |
12.66 (-0.16%) |
12.76 |
12.55 - 12.76 |
2.0599 times |
Fri 17 October 2025 |
12.68 (-1.17%) |
12.74 |
12.64 - 12.80 |
1.8688 times |
Tue 07 October 2025 |
12.83 (-0.08%) |
12.85 |
12.79 - 12.87 |
0.1035 times |
Fri 03 October 2025 |
12.84 (0.94%) |
12.67 |
12.57 - 12.90 |
0.4577 times |
Monthly price and charts WesternAsset Strong monthly Stock price targets for WesternAsset PAI are 12.37 and 12.49 | Monthly Target 1 | 12.31 | | Monthly Target 2 | 12.37 | | Monthly Target 3 | 12.43 | | Monthly Target 4 | 12.49 | | Monthly Target 5 | 12.55 |
Monthly price and volumes Western Asset
| Date |
Closing |
Open |
Range |
Volume |
Thu 04 December 2025 |
12.43 (-0.32%) |
12.43 |
12.37 - 12.49 |
0.2513 times |
Fri 28 November 2025 |
12.47 (-0.8%) |
12.52 |
12.28 - 12.58 |
1.1337 times |
Fri 31 October 2025 |
12.57 (-1.95%) |
12.84 |
12.50 - 12.90 |
2.2696 times |
Tue 30 September 2025 |
12.82 (1.99%) |
12.52 |
12.43 - 13.01 |
1.1928 times |
Fri 29 August 2025 |
12.57 (-2.18%) |
12.95 |
12.52 - 13.09 |
1.0079 times |
Thu 31 July 2025 |
12.85 (-1%) |
13.09 |
12.55 - 13.66 |
0.6329 times |
Mon 30 June 2025 |
12.98 (4.68%) |
12.40 |
12.28 - 13.00 |
0.9153 times |
Fri 30 May 2025 |
12.40 (0.16%) |
12.55 |
12.10 - 12.79 |
0.7469 times |
Wed 30 April 2025 |
12.38 (-3.66%) |
12.97 |
11.41 - 12.97 |
0.8745 times |
Mon 31 March 2025 |
12.85 (0.16%) |
12.83 |
12.35 - 13.00 |
0.9752 times |
Fri 28 February 2025 |
12.83 (1.5%) |
12.72 |
12.45 - 12.90 |
1.1244 times |
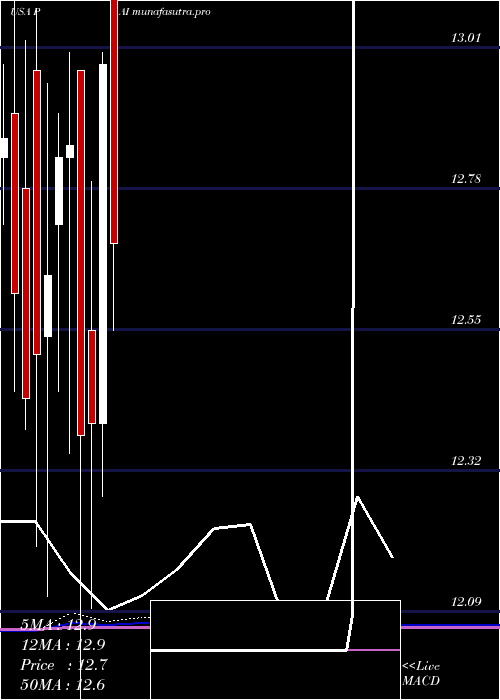
DMA SMA EMA moving averages of Western Asset PAI
DMA (daily moving average) of Western Asset PAI
| DMA period | DMA value | | 5 day DMA | 12.42 | | 12 day DMA | 12.4 | | 20 day DMA | 12.43 | | 35 day DMA | 12.5 | | 50 day DMA | 12.59 | | 100 day DMA | 12.67 | | 150 day DMA | 12.62 | | 200 day DMA | 12.57 | EMA (exponential moving average) of Western Asset PAI
| EMA period | EMA current | EMA prev | EMA prev2 | | 5 day EMA | 12.42 | 12.41 | 12.41 | | 12 day EMA | 12.42 | 12.42 | 12.42 | | 20 day EMA | 12.45 | 12.45 | 12.46 | | 35 day EMA | 12.51 | 12.52 | 12.53 | | 50 day EMA | 12.6 | 12.61 | 12.62 |
SMA (simple moving average) of Western Asset PAI
| SMA period | SMA current | SMA prev | SMA prev2 | | 5 day SMA | 12.42 | 12.42 | 12.43 | | 12 day SMA | 12.4 | 12.41 | 12.41 | | 20 day SMA | 12.43 | 12.43 | 12.44 | | 35 day SMA | 12.5 | 12.51 | 12.52 | | 50 day SMA | 12.59 | 12.61 | 12.62 | | 100 day SMA | 12.67 | 12.68 | 12.69 | | 150 day SMA | 12.62 | 12.62 | 12.62 | | 200 day SMA | 12.57 | 12.58 | 12.58 |
|
|
