PlainsGroup PAGP full analysis,charts,indicators,moving averages,SMA,DMA,EMA,ADX,MACD,RSIPlains Group PAGP WideScreen charts, DMA,SMA,EMA technical analysis, forecast prediction, by indicators ADX,MACD,RSI,CCI USA stock exchange
operates under Energy sector & deals in Natural Gas Distribution
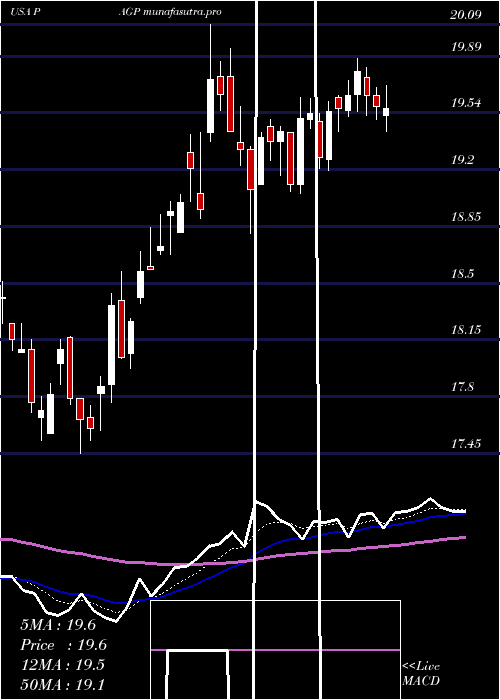
Daily price and charts and targets PlainsGroup Strong Daily Stock price targets for PlainsGroup PAGP are 18.73 and 19.01 | Daily Target 1 | 18.67 | | Daily Target 2 | 18.78 | | Daily Target 3 | 18.95 | | Daily Target 4 | 19.06 | | Daily Target 5 | 19.23 |
Daily price and volume Plains Group
| Date |
Closing |
Open |
Range |
Volume |
Fri 05 December 2025 |
18.89 (0%) |
19.00 |
18.84 - 19.12 |
1.2377 times |
Thu 04 December 2025 |
18.89 (0.11%) |
18.98 |
18.87 - 19.02 |
0.5131 times |
Wed 03 December 2025 |
18.87 (1.45%) |
18.72 |
18.65 - 18.96 |
1.0948 times |
Tue 02 December 2025 |
18.60 (-0.32%) |
18.72 |
18.60 - 18.80 |
0.851 times |
Mon 01 December 2025 |
18.66 (0.65%) |
18.53 |
18.50 - 18.70 |
1.0321 times |
Fri 28 November 2025 |
18.54 (0.32%) |
18.53 |
18.48 - 18.66 |
0.788 times |
Wed 26 November 2025 |
18.48 (0.11%) |
18.52 |
18.44 - 18.69 |
0.8797 times |
Tue 25 November 2025 |
18.46 (1.48%) |
18.25 |
18.24 - 18.57 |
1.7135 times |
Mon 24 November 2025 |
18.19 (1%) |
17.95 |
17.89 - 18.25 |
1.2523 times |
Fri 21 November 2025 |
18.01 (0.11%) |
18.00 |
17.86 - 18.07 |
0.6377 times |
Thu 20 November 2025 |
17.99 (0.67%) |
17.90 |
17.79 - 18.14 |
1.4005 times |
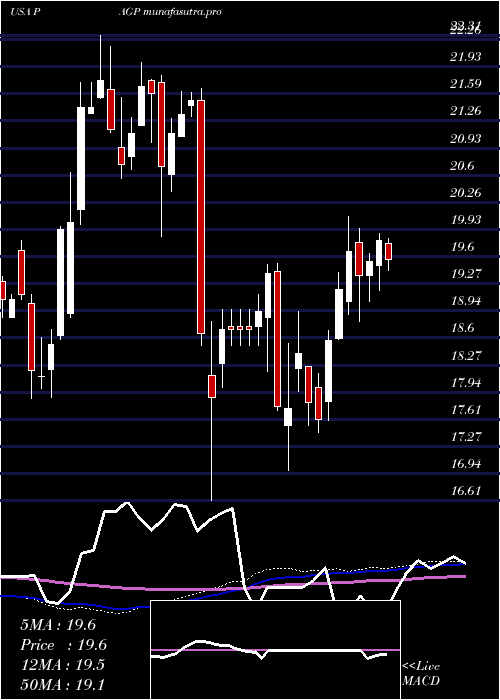
Weekly price and charts PlainsGroup Strong weekly Stock price targets for PlainsGroup PAGP are 18.7 and 19.32 | Weekly Target 1 | 18.22 | | Weekly Target 2 | 18.55 | | Weekly Target 3 | 18.836666666667 | | Weekly Target 4 | 19.17 | | Weekly Target 5 | 19.46 |
Weekly price and volumes for Plains Group
| Date |
Closing |
Open |
Range |
Volume |
Fri 05 December 2025 |
18.89 (1.89%) |
18.53 |
18.50 - 19.12 |
1.0154 times |
Fri 28 November 2025 |
18.54 (2.94%) |
17.95 |
17.89 - 18.69 |
0.9949 times |
Fri 21 November 2025 |
18.01 (0.84%) |
17.83 |
17.62 - 18.14 |
0.9743 times |
Fri 14 November 2025 |
17.86 (1.94%) |
17.60 |
17.35 - 17.97 |
0.783 times |
Fri 07 November 2025 |
17.52 (1.45%) |
17.07 |
16.89 - 17.60 |
1.2315 times |
Fri 31 October 2025 |
17.27 (0%) |
17.41 |
17.19 - 17.49 |
0.2033 times |
Fri 31 October 2025 |
17.27 (-2.04%) |
17.63 |
17.19 - 17.90 |
1.2786 times |
Fri 24 October 2025 |
17.63 (4.38%) |
16.97 |
16.93 - 17.83 |
1.3085 times |
Fri 17 October 2025 |
16.89 (0.24%) |
17.00 |
16.69 - 17.24 |
0.9984 times |
Fri 10 October 2025 |
16.85 (-6.75%) |
18.18 |
16.82 - 18.18 |
1.2121 times |
Fri 03 October 2025 |
18.07 (-4.09%) |
18.78 |
18.05 - 18.82 |
0.9296 times |
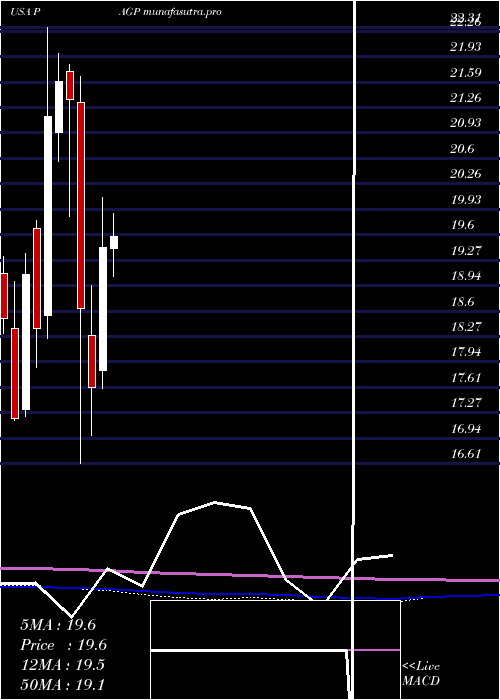
Monthly price and charts PlainsGroup Strong monthly Stock price targets for PlainsGroup PAGP are 18.7 and 19.32 | Monthly Target 1 | 18.22 | | Monthly Target 2 | 18.55 | | Monthly Target 3 | 18.836666666667 | | Monthly Target 4 | 19.17 | | Monthly Target 5 | 19.46 |
Monthly price and volumes Plains Group
| Date |
Closing |
Open |
Range |
Volume |
Fri 05 December 2025 |
18.89 (1.89%) |
18.53 |
18.50 - 19.12 |
0.2222 times |
Fri 28 November 2025 |
18.54 (7.35%) |
17.07 |
16.89 - 18.69 |
0.8719 times |
Fri 31 October 2025 |
17.27 (-5.32%) |
18.28 |
16.69 - 18.38 |
1.1885 times |
Tue 30 September 2025 |
18.24 (-5.49%) |
19.25 |
18.09 - 19.28 |
0.8453 times |
Fri 29 August 2025 |
19.30 (-1.53%) |
19.31 |
18.58 - 19.63 |
1.0216 times |
Thu 31 July 2025 |
19.60 (0.87%) |
19.42 |
19.05 - 20.19 |
1.0347 times |
Mon 30 June 2025 |
19.43 (10.4%) |
17.82 |
17.59 - 20.09 |
1.3562 times |
Fri 30 May 2025 |
17.60 (-5.58%) |
18.28 |
16.98 - 18.93 |
1.2433 times |
Wed 30 April 2025 |
18.64 (-12.73%) |
21.32 |
16.61 - 21.66 |
1.4399 times |
Mon 31 March 2025 |
21.36 (-1.11%) |
21.73 |
19.84 - 21.82 |
0.7763 times |
Fri 28 February 2025 |
21.60 (2.13%) |
20.94 |
20.55 - 21.97 |
1.221 times |
DMA SMA EMA moving averages of Plains Group PAGP
DMA (daily moving average) of Plains Group PAGP
| DMA period | DMA value | | 5 day DMA | 18.78 | | 12 day DMA | 18.45 | | 20 day DMA | 18.13 | | 35 day DMA | 17.83 | | 50 day DMA | 17.79 | | 100 day DMA | 18.42 | | 150 day DMA | 18.51 | | 200 day DMA | 18.89 | EMA (exponential moving average) of Plains Group PAGP
| EMA period | EMA current | EMA prev | EMA prev2 | | 5 day EMA | 18.77 | 18.71 | 18.62 | | 12 day EMA | 18.49 | 18.42 | 18.34 | | 20 day EMA | 18.27 | 18.21 | 18.14 | | 35 day EMA | 18.12 | 18.07 | 18.02 | | 50 day EMA | 17.95 | 17.91 | 17.87 |
SMA (simple moving average) of Plains Group PAGP
| SMA period | SMA current | SMA prev | SMA prev2 | | 5 day SMA | 18.78 | 18.71 | 18.63 | | 12 day SMA | 18.45 | 18.37 | 18.27 | | 20 day SMA | 18.13 | 18.05 | 17.97 | | 35 day SMA | 17.83 | 17.77 | 17.72 | | 50 day SMA | 17.79 | 17.79 | 17.79 | | 100 day SMA | 18.42 | 18.42 | 18.43 | | 150 day SMA | 18.51 | 18.5 | 18.5 | | 200 day SMA | 18.89 | 18.9 | 18.91 |
|
|
