OccidentalPetroleum OXY full analysis,charts,indicators,moving averages,SMA,DMA,EMA,ADX,MACD,RSIOccidental Petroleum OXY WideScreen charts, DMA,SMA,EMA technical analysis, forecast prediction, by indicators ADX,MACD,RSI,CCI USA stock exchange
operates under Energy sector & deals in Oil Gas Production
Daily price and charts and targets OccidentalPetroleum Strong Daily Stock price targets for OccidentalPetroleum OXY are 40.93 and 41.55 | Daily Target 1 | 40.49 | | Daily Target 2 | 40.75 | | Daily Target 3 | 41.106666666667 | | Daily Target 4 | 41.37 | | Daily Target 5 | 41.73 |
Daily price and volume Occidental Petroleum
| Date |
Closing |
Open |
Range |
Volume |
Mon 20 October 2025 |
41.02 (0.29%) |
41.00 |
40.84 - 41.46 |
0.4935 times |
Fri 17 October 2025 |
40.90 (-0.34%) |
40.80 |
40.52 - 41.07 |
0.7775 times |
Thu 16 October 2025 |
41.04 (-2.01%) |
41.99 |
40.51 - 42.09 |
0.875 times |
Wed 15 October 2025 |
41.88 (-0.95%) |
42.50 |
41.64 - 42.57 |
0.6776 times |
Tue 14 October 2025 |
42.28 (-0.33%) |
41.94 |
41.52 - 42.53 |
0.7354 times |
Mon 13 October 2025 |
42.42 (-6.42%) |
42.87 |
42.13 - 42.87 |
0.6953 times |
Tue 07 October 2025 |
45.33 (-0.07%) |
45.25 |
44.81 - 45.41 |
0.7029 times |
Mon 06 October 2025 |
45.36 (1.02%) |
45.29 |
44.65 - 45.98 |
0.8519 times |
Fri 03 October 2025 |
44.90 (0.81%) |
44.81 |
44.50 - 45.33 |
1.1668 times |
Thu 02 October 2025 |
44.54 (-6.66%) |
48.00 |
43.84 - 49.18 |
3.0241 times |
Wed 01 October 2025 |
47.72 (0.99%) |
47.46 |
47.13 - 47.99 |
0.7983 times |
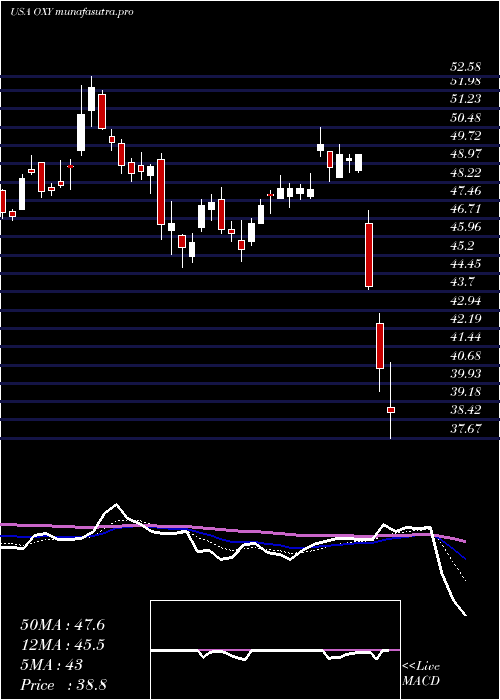
Weekly price and charts OccidentalPetroleum Strong weekly Stock price targets for OccidentalPetroleum OXY are 40.93 and 41.55 | Weekly Target 1 | 40.49 | | Weekly Target 2 | 40.75 | | Weekly Target 3 | 41.106666666667 | | Weekly Target 4 | 41.37 | | Weekly Target 5 | 41.73 |
Weekly price and volumes for Occidental Petroleum
| Date |
Closing |
Open |
Range |
Volume |
Mon 20 October 2025 |
41.02 (0.29%) |
41.00 |
40.84 - 41.46 |
0.1616 times |
Fri 17 October 2025 |
40.90 (-9.77%) |
42.87 |
40.51 - 42.87 |
1.2315 times |
Tue 07 October 2025 |
45.33 (0.96%) |
45.29 |
44.65 - 45.98 |
0.5091 times |
Fri 03 October 2025 |
44.90 (-5.41%) |
48.25 |
43.84 - 49.45 |
2.5737 times |
Fri 26 September 2025 |
47.47 (2.97%) |
45.75 |
45.44 - 48.51 |
1.1696 times |
Fri 19 September 2025 |
46.10 (0.94%) |
45.86 |
45.18 - 47.99 |
1.3672 times |
Fri 12 September 2025 |
45.67 (-0.52%) |
46.15 |
44.77 - 46.55 |
0.842 times |
Fri 05 September 2025 |
45.91 (-3.57%) |
47.45 |
45.00 - 48.11 |
0.9215 times |
Fri 29 August 2025 |
47.61 (0%) |
47.55 |
47.44 - 48.03 |
0.1549 times |
Fri 29 August 2025 |
47.61 (3.88%) |
45.73 |
45.54 - 48.03 |
1.069 times |
Fri 22 August 2025 |
45.83 (2.73%) |
43.98 |
43.62 - 46.02 |
1.1202 times |
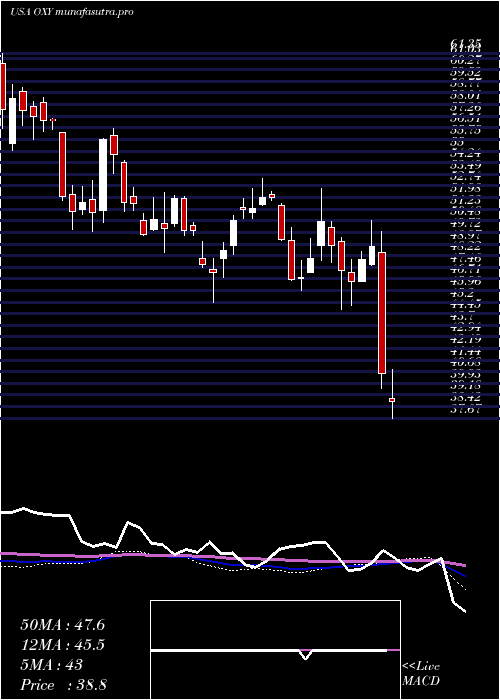
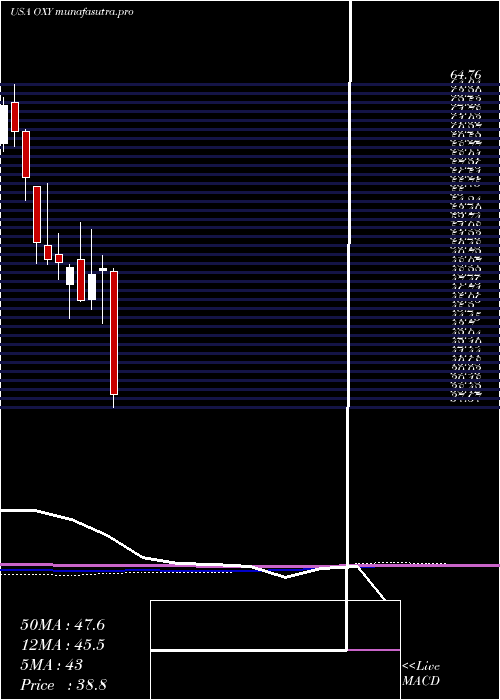
Monthly price and charts OccidentalPetroleum Strong monthly Stock price targets for OccidentalPetroleum OXY are 36.43 and 45.1 | Monthly Target 1 | 34.9 | | Monthly Target 2 | 37.96 | | Monthly Target 3 | 43.57 | | Monthly Target 4 | 46.63 | | Monthly Target 5 | 52.24 |
Monthly price and volumes Occidental Petroleum
| Date |
Closing |
Open |
Range |
Volume |
Mon 20 October 2025 |
41.02 (-13.19%) |
47.46 |
40.51 - 49.18 |
0.5968 times |
Tue 30 September 2025 |
47.25 (-0.76%) |
47.45 |
44.77 - 49.45 |
0.8845 times |
Fri 29 August 2025 |
47.61 (8.35%) |
43.59 |
42.32 - 48.03 |
0.8957 times |
Thu 31 July 2025 |
43.94 (4.59%) |
42.06 |
41.65 - 46.44 |
1.0163 times |
Mon 30 June 2025 |
42.01 (3.02%) |
41.79 |
40.96 - 47.33 |
1.2003 times |
Fri 30 May 2025 |
40.78 (3.48%) |
39.32 |
38.72 - 44.93 |
0.9896 times |
Wed 30 April 2025 |
39.41 (-20.16%) |
49.12 |
34.79 - 49.36 |
1.4009 times |
Mon 31 March 2025 |
49.36 (1.06%) |
49.15 |
44.70 - 50.47 |
1.0607 times |
Fri 28 February 2025 |
48.84 (4.69%) |
46.76 |
45.94 - 52.58 |
0.9951 times |
Fri 31 January 2025 |
46.65 (-5.59%) |
50.10 |
46.60 - 53.20 |
0.9601 times |
Tue 31 December 2024 |
49.41 (-0.88%) |
48.00 |
45.17 - 49.68 |
0.94 times |
DMA SMA EMA moving averages of Occidental Petroleum OXY
DMA (daily moving average) of Occidental Petroleum OXY
| DMA period | DMA value | | 5 day DMA | 41.42 | | 12 day DMA | 43.72 | | 20 day DMA | 44.99 | | 35 day DMA | 45.66 | | 50 day DMA | 45.41 | | 100 day DMA | 44.49 | | 150 day DMA | 43.74 | | 200 day DMA | 45.09 | EMA (exponential moving average) of Occidental Petroleum OXY
| EMA period | EMA current | EMA prev | EMA prev2 | | 5 day EMA | 41.63 | 41.93 | 42.45 | | 12 day EMA | 43.14 | 43.53 | 44.01 | | 20 day EMA | 44.05 | 44.37 | 44.74 | | 35 day EMA | 44.64 | 44.85 | 45.08 | | 50 day EMA | 44.84 | 45 | 45.17 |
SMA (simple moving average) of Occidental Petroleum OXY
| SMA period | SMA current | SMA prev | SMA prev2 | | 5 day SMA | 41.42 | 41.7 | 42.59 | | 12 day SMA | 43.72 | 44.31 | 44.86 | | 20 day SMA | 44.99 | 45.3 | 45.64 | | 35 day SMA | 45.66 | 45.83 | 45.98 | | 50 day SMA | 45.41 | 45.44 | 45.48 | | 100 day SMA | 44.49 | 44.49 | 44.5 | | 150 day SMA | 43.74 | 43.77 | 43.81 | | 200 day SMA | 45.09 | 45.12 | 45.16 |
|
|
