OxfordLane OXLC full analysis,charts,indicators,moving averages,SMA,DMA,EMA,ADX,MACD,RSIOxford Lane OXLC WideScreen charts, DMA,SMA,EMA technical analysis, forecast prediction, by indicators ADX,MACD,RSI,CCI USA stock exchange
operates under N A sector & deals in N A
Daily price and charts and targets OxfordLane Strong Daily Stock price targets for OxfordLane OXLC are 15.17 and 15.34 | Daily Target 1 | 15.13 | | Daily Target 2 | 15.2 | | Daily Target 3 | 15.296666666667 | | Daily Target 4 | 15.37 | | Daily Target 5 | 15.47 |
Daily price and volume Oxford Lane
| Date |
Closing |
Open |
Range |
Volume |
Thu 04 December 2025 |
15.28 (0.39%) |
15.30 |
15.22 - 15.39 |
0.6379 times |
Wed 03 December 2025 |
15.22 (1.13%) |
15.09 |
15.05 - 15.25 |
0.4645 times |
Tue 02 December 2025 |
15.05 (0.07%) |
15.12 |
14.92 - 15.20 |
0.5897 times |
Mon 01 December 2025 |
15.04 (0.33%) |
14.99 |
14.71 - 15.10 |
1.0396 times |
Fri 28 November 2025 |
14.99 (1.22%) |
14.94 |
14.90 - 15.10 |
0.9726 times |
Wed 26 November 2025 |
14.81 (4.08%) |
14.27 |
14.22 - 14.84 |
0.7157 times |
Tue 25 November 2025 |
14.23 (2.08%) |
13.90 |
13.87 - 14.37 |
1.0068 times |
Mon 24 November 2025 |
13.94 (5.93%) |
13.21 |
13.19 - 13.98 |
1.5263 times |
Fri 21 November 2025 |
13.16 (0.84%) |
13.06 |
12.95 - 13.26 |
1.5895 times |
Thu 20 November 2025 |
13.05 (-0.08%) |
13.11 |
13.04 - 13.40 |
1.4573 times |
Wed 19 November 2025 |
13.06 (-1.51%) |
13.22 |
12.88 - 13.37 |
2.0151 times |
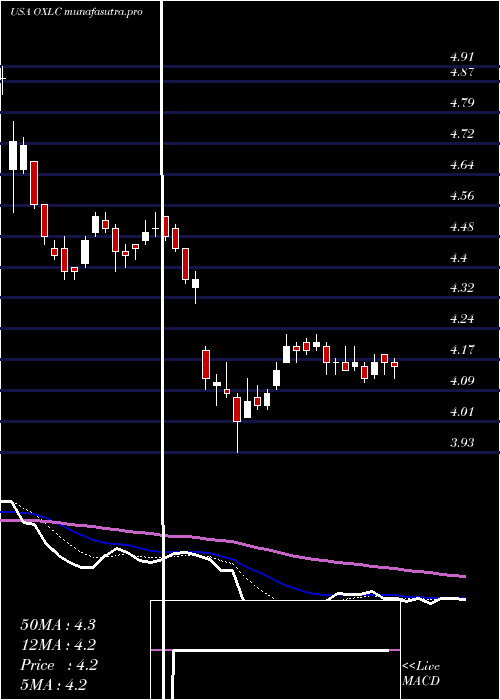
Weekly price and charts OxfordLane Strong weekly Stock price targets for OxfordLane OXLC are 15 and 15.68 | Weekly Target 1 | 14.45 | | Weekly Target 2 | 14.86 | | Weekly Target 3 | 15.126666666667 | | Weekly Target 4 | 15.54 | | Weekly Target 5 | 15.81 |
Weekly price and volumes for Oxford Lane
| Date |
Closing |
Open |
Range |
Volume |
Thu 04 December 2025 |
15.28 (1.93%) |
14.99 |
14.71 - 15.39 |
0.6238 times |
Fri 28 November 2025 |
14.99 (13.91%) |
13.21 |
13.19 - 15.10 |
0.964 times |
Fri 21 November 2025 |
13.16 (-7.06%) |
14.13 |
12.88 - 14.15 |
1.9899 times |
Fri 14 November 2025 |
14.16 (-6.35%) |
15.23 |
14.15 - 15.32 |
0.9951 times |
Fri 07 November 2025 |
15.12 (-2.89%) |
15.24 |
14.87 - 15.38 |
0.6355 times |
Fri 31 October 2025 |
15.57 (0%) |
15.44 |
15.26 - 15.64 |
0.2298 times |
Fri 31 October 2025 |
15.57 (0.71%) |
15.51 |
15.09 - 15.73 |
0.8505 times |
Fri 24 October 2025 |
15.46 (1.05%) |
15.18 |
14.49 - 15.49 |
1.4226 times |
Fri 17 October 2025 |
15.30 (-6.99%) |
16.46 |
14.42 - 16.82 |
1.4658 times |
Fri 10 October 2025 |
16.45 (-3.46%) |
17.08 |
16.39 - 17.18 |
0.8231 times |
Fri 03 October 2025 |
17.04 (0.71%) |
16.93 |
16.45 - 17.33 |
1.0354 times |
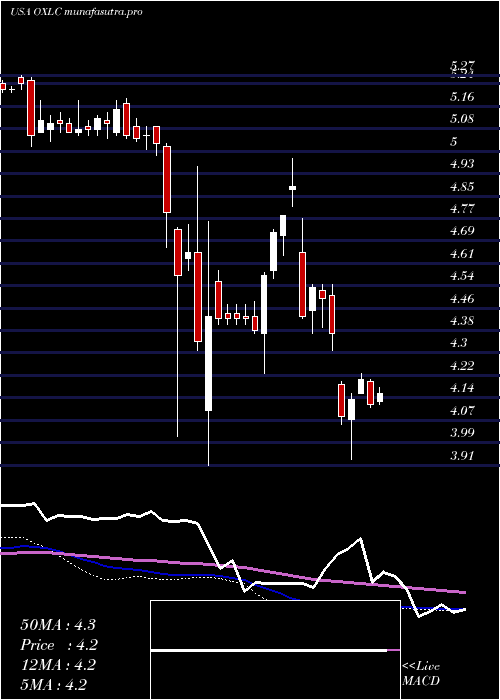
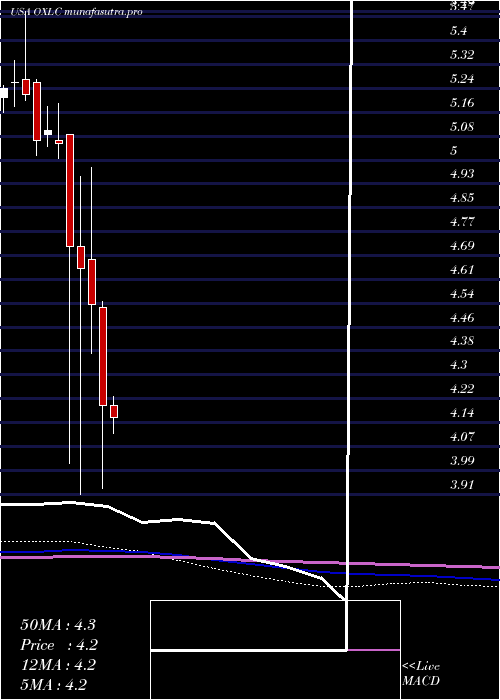
Monthly price and charts OxfordLane Strong monthly Stock price targets for OxfordLane OXLC are 15 and 15.68 | Monthly Target 1 | 14.45 | | Monthly Target 2 | 14.86 | | Monthly Target 3 | 15.126666666667 | | Monthly Target 4 | 15.54 | | Monthly Target 5 | 15.81 |
Monthly price and volumes Oxford Lane
| Date |
Closing |
Open |
Range |
Volume |
Thu 04 December 2025 |
15.28 (1.93%) |
14.99 |
14.71 - 15.39 |
0.0343 times |
Fri 28 November 2025 |
14.99 (-3.73%) |
15.24 |
12.88 - 15.38 |
0.252 times |
Fri 31 October 2025 |
15.57 (-8.03%) |
16.90 |
14.42 - 17.33 |
0.2867 times |
Tue 30 September 2025 |
16.93 (351.47%) |
3.69 |
3.60 - 18.20 |
0.4668 times |
Fri 29 August 2025 |
3.75 (5.34%) |
3.52 |
3.18 - 3.81 |
1.3873 times |
Thu 31 July 2025 |
3.56 (-15.24%) |
4.20 |
3.27 - 4.23 |
2.0649 times |
Mon 30 June 2025 |
4.20 (-7.28%) |
4.52 |
3.93 - 4.54 |
1.0338 times |
Fri 30 May 2025 |
4.53 (-2.58%) |
4.68 |
4.37 - 4.98 |
1.1934 times |
Wed 30 April 2025 |
4.65 (-1.48%) |
4.72 |
3.91 - 4.95 |
1.4718 times |
Mon 31 March 2025 |
4.72 (-6.72%) |
5.09 |
4.01 - 5.09 |
1.809 times |
Fri 28 February 2025 |
5.06 (-0.78%) |
5.07 |
5.01 - 5.19 |
1.2802 times |
DMA SMA EMA moving averages of Oxford Lane OXLC
DMA (daily moving average) of Oxford Lane OXLC
| DMA period | DMA value | | 5 day DMA | 15.12 | | 12 day DMA | 14.26 | | 20 day DMA | 14.48 | | 35 day DMA | 14.82 | | 50 day DMA | 15.42 | | 100 day DMA | 11.31 | | 150 day DMA | 9.02 | | 200 day DMA | 7.93 | EMA (exponential moving average) of Oxford Lane OXLC
| EMA period | EMA current | EMA prev | EMA prev2 | | 5 day EMA | 15.04 | 14.92 | 14.77 | | 12 day EMA | 14.72 | 14.62 | 14.51 | | 20 day EMA | 14.73 | 14.67 | 14.61 | | 35 day EMA | 15.04 | 15.03 | 15.02 | | 50 day EMA | 15.55 | 15.56 | 15.57 |
SMA (simple moving average) of Oxford Lane OXLC
| SMA period | SMA current | SMA prev | SMA prev2 | | 5 day SMA | 15.12 | 15.02 | 14.82 | | 12 day SMA | 14.26 | 14.13 | 14.04 | | 20 day SMA | 14.48 | 14.48 | 14.48 | | 35 day SMA | 14.82 | 14.85 | 14.88 | | 50 day SMA | 15.42 | 15.46 | 15.5 | | 100 day SMA | 11.31 | 11.2 | 11.09 | | 150 day SMA | 9.02 | 8.95 | 8.88 | | 200 day SMA | 7.93 | 7.88 | 7.83 |
|
|
