OxbridgeRe OXBRW full analysis,charts,indicators,moving averages,SMA,DMA,EMA,ADX,MACD,RSIOxbridge Re OXBRW WideScreen charts, DMA,SMA,EMA technical analysis, forecast prediction, by indicators ADX,MACD,RSI,CCI USA stock exchange
operates under Finance sector & deals in Property Casualty Insurers
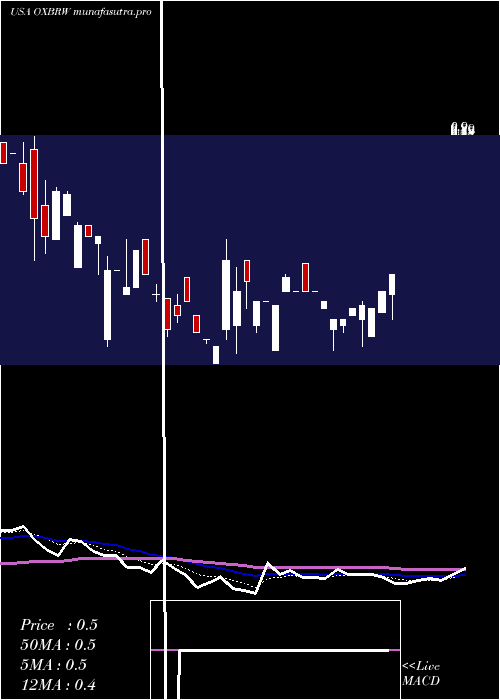
Daily price and charts and targets OxbridgeRe Strong Daily Stock price targets for OxbridgeRe OXBRW are 0.19 and 0.23 | Daily Target 1 | 0.18 | | Daily Target 2 | 0.2 | | Daily Target 3 | 0.22333333333333 | | Daily Target 4 | 0.24 | | Daily Target 5 | 0.26 |
Daily price and volume Oxbridge Re
| Date |
Closing |
Open |
Range |
Volume |
Thu 04 December 2025 |
0.21 (0%) |
0.23 |
0.21 - 0.25 |
2.0844 times |
Wed 03 December 2025 |
0.21 (-8.7%) |
0.21 |
0.21 - 0.21 |
0.0528 times |
Tue 02 December 2025 |
0.23 (0%) |
0.23 |
0.23 - 0.23 |
0.0792 times |
Fri 28 November 2025 |
0.23 (-8%) |
0.23 |
0.23 - 0.23 |
0.0792 times |
Tue 25 November 2025 |
0.25 (0%) |
0.25 |
0.25 - 0.25 |
0.1319 times |
Mon 24 November 2025 |
0.25 (0%) |
0.28 |
0.25 - 0.28 |
0.0528 times |
Fri 21 November 2025 |
0.25 (-21.88%) |
0.25 |
0.25 - 0.25 |
2.6913 times |
Thu 13 November 2025 |
0.32 (18.52%) |
0.27 |
0.27 - 0.32 |
0.6332 times |
Wed 12 November 2025 |
0.27 (-18.18%) |
0.28 |
0.21 - 0.32 |
3.7995 times |
Fri 07 November 2025 |
0.33 (-8.33%) |
0.33 |
0.33 - 0.34 |
0.3958 times |
Thu 06 November 2025 |
0.36 (20%) |
0.26 |
0.24 - 0.36 |
0.2375 times |
Weekly price and charts OxbridgeRe Strong weekly Stock price targets for OxbridgeRe OXBRW are 0.19 and 0.23 | Weekly Target 1 | 0.18 | | Weekly Target 2 | 0.2 | | Weekly Target 3 | 0.22333333333333 | | Weekly Target 4 | 0.24 | | Weekly Target 5 | 0.26 |
Weekly price and volumes for Oxbridge Re
| Date |
Closing |
Open |
Range |
Volume |
Thu 04 December 2025 |
0.21 (-8.7%) |
0.23 |
0.21 - 0.25 |
0.5578 times |
Fri 28 November 2025 |
0.23 (-8%) |
0.28 |
0.23 - 0.28 |
0.0664 times |
Fri 21 November 2025 |
0.25 (-24.24%) |
0.28 |
0.21 - 0.32 |
1.7928 times |
Fri 07 November 2025 |
0.33 (-10.81%) |
0.32 |
0.24 - 0.36 |
0.2258 times |
Thu 30 October 2025 |
0.37 (15.63%) |
0.28 |
0.24 - 0.39 |
4.6215 times |
Thu 23 October 2025 |
0.32 (-5.88%) |
0.34 |
0.28 - 0.34 |
1.4807 times |
Fri 17 October 2025 |
0.34 (0%) |
0.38 |
0.34 - 0.40 |
0.5511 times |
Fri 10 October 2025 |
0.34 (-20.93%) |
0.40 |
0.34 - 0.43 |
0.1461 times |
Fri 26 September 2025 |
0.43 (-4.44%) |
0.40 |
0.40 - 0.45 |
0.093 times |
Fri 19 September 2025 |
0.45 (-4.26%) |
0.40 |
0.39 - 0.47 |
0.4648 times |
Fri 12 September 2025 |
0.47 (17.5%) |
0.36 |
0.32 - 0.49 |
1.992 times |
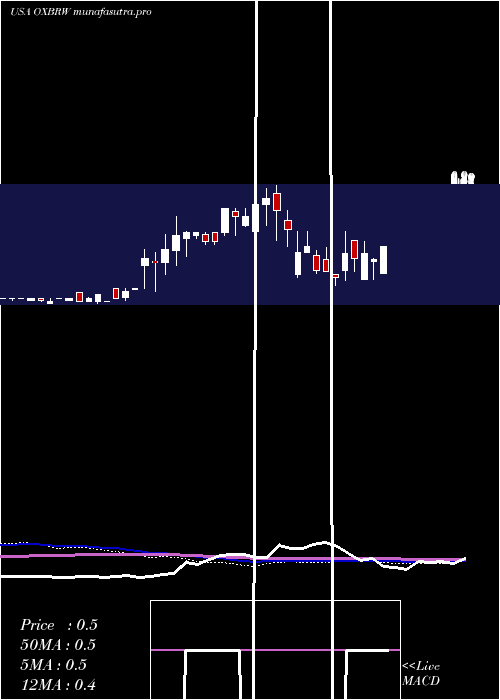
Monthly price and charts OxbridgeRe Strong monthly Stock price targets for OxbridgeRe OXBRW are 0.19 and 0.23 | Monthly Target 1 | 0.18 | | Monthly Target 2 | 0.2 | | Monthly Target 3 | 0.22333333333333 | | Monthly Target 4 | 0.24 | | Monthly Target 5 | 0.26 |
Monthly price and volumes Oxbridge Re
| Date |
Closing |
Open |
Range |
Volume |
Thu 04 December 2025 |
0.21 (-8.7%) |
0.23 |
0.21 - 0.25 |
0.1328 times |
Fri 28 November 2025 |
0.23 (-37.84%) |
0.32 |
0.21 - 0.36 |
0.4963 times |
Thu 30 October 2025 |
0.37 (-7.5%) |
0.35 |
0.24 - 0.40 |
1.6028 times |
Tue 30 September 2025 |
0.40 (2.56%) |
0.39 |
0.32 - 0.49 |
0.9784 times |
Fri 29 August 2025 |
0.39 (21.88%) |
0.29 |
0.27 - 0.45 |
1.1997 times |
Thu 31 July 2025 |
0.32 (-3.03%) |
0.33 |
0.21 - 0.60 |
2.768 times |
Mon 30 June 2025 |
0.33 (-25%) |
0.46 |
0.28 - 0.49 |
0.2039 times |
Fri 30 May 2025 |
0.44 (-8.33%) |
0.35 |
0.28 - 0.53 |
1.0116 times |
Mon 21 April 2025 |
0.48 (26.32%) |
0.49 |
0.24 - 0.60 |
0.3891 times |
Mon 31 March 2025 |
0.38 (-48.65%) |
0.67 |
0.29 - 0.74 |
1.2174 times |
Fri 28 February 2025 |
0.74 (5.71%) |
0.64 |
0.54 - 0.90 |
2.9226 times |

DMA SMA EMA moving averages of Oxbridge Re OXBRW
DMA (daily moving average) of Oxbridge Re OXBRW
| DMA period | DMA value | | 5 day DMA | 0.23 | | 12 day DMA | 0.27 | | 20 day DMA | 0.29 | | 35 day DMA | 0.35 | | 50 day DMA | 0.36 | | 100 day DMA | 0.37 | | 150 day DMA | 0.44 | | 200 day DMA | 0.41 | EMA (exponential moving average) of Oxbridge Re OXBRW
| EMA period | EMA current | EMA prev | EMA prev2 | | 5 day EMA | 0.23 | 0.24 | 0.25 | | 12 day EMA | 0.26 | 0.27 | 0.28 | | 20 day EMA | 0.27 | 0.28 | 0.29 | | 35 day EMA | 0.29 | 0.3 | 0.31 | | 50 day EMA | 0.33 | 0.34 | 0.35 |
SMA (simple moving average) of Oxbridge Re OXBRW
| SMA period | SMA current | SMA prev | SMA prev2 | | 5 day SMA | 0.23 | 0.23 | 0.24 | | 12 day SMA | 0.27 | 0.28 | 0.29 | | 20 day SMA | 0.29 | 0.3 | 0.31 | | 35 day SMA | 0.35 | 0.35 | 0.36 | | 50 day SMA | 0.36 | 0.36 | 0.36 | | 100 day SMA | 0.37 | 0.37 | 0.37 | | 150 day SMA | 0.44 | 0.44 | 0.45 | | 200 day SMA | 0.41 | 0.41 | 0.41 |
|
|
