OxbridgeRe OXBR full analysis,charts,indicators,moving averages,SMA,DMA,EMA,ADX,MACD,RSIOxbridge Re OXBR WideScreen charts, DMA,SMA,EMA technical analysis, forecast prediction, by indicators ADX,MACD,RSI,CCI USA stock exchange
operates under Finance sector & deals in Property Casualty Insurers
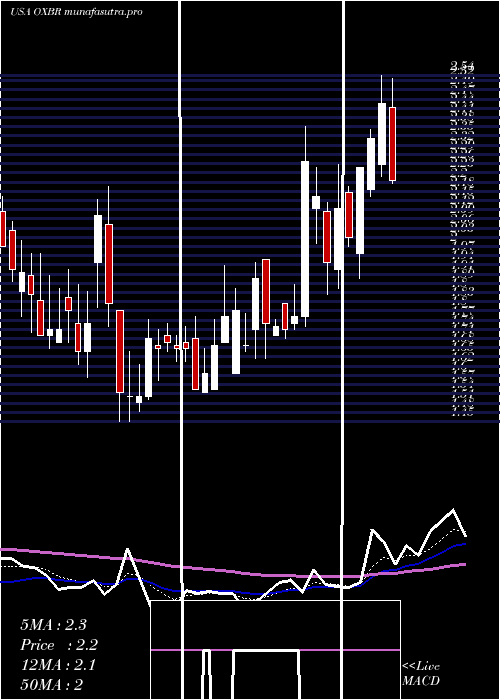
Daily price and charts and targets OxbridgeRe Strong Daily Stock price targets for OxbridgeRe OXBR are 1.33 and 1.39 | Daily Target 1 | 1.28 | | Daily Target 2 | 1.32 | | Daily Target 3 | 1.34 | | Daily Target 4 | 1.38 | | Daily Target 5 | 1.4 |
Daily price and volume Oxbridge Re
| Date |
Closing |
Open |
Range |
Volume |
Thu 04 December 2025 |
1.36 (0%) |
1.34 |
1.30 - 1.36 |
1.0562 times |
Wed 03 December 2025 |
1.36 (3.03%) |
1.35 |
1.33 - 1.36 |
0.8539 times |
Tue 02 December 2025 |
1.32 (0%) |
1.34 |
1.29 - 1.36 |
0.8764 times |
Mon 01 December 2025 |
1.32 (-5.04%) |
1.33 |
1.32 - 1.42 |
0.1199 times |
Fri 28 November 2025 |
1.39 (-2.8%) |
1.38 |
1.37 - 1.39 |
0.0524 times |
Wed 26 November 2025 |
1.43 (-3.38%) |
1.45 |
1.43 - 1.50 |
1.4532 times |
Tue 25 November 2025 |
1.48 (4.96%) |
1.43 |
1.43 - 1.48 |
0.382 times |
Mon 24 November 2025 |
1.41 (10.16%) |
1.31 |
1.28 - 1.44 |
2 times |
Fri 21 November 2025 |
1.28 (9.4%) |
1.15 |
1.15 - 1.29 |
2.2921 times |
Thu 20 November 2025 |
1.17 (-2.5%) |
1.16 |
1.15 - 1.19 |
0.9139 times |
Wed 19 November 2025 |
1.20 (-0.83%) |
1.20 |
1.20 - 1.23 |
1.2734 times |
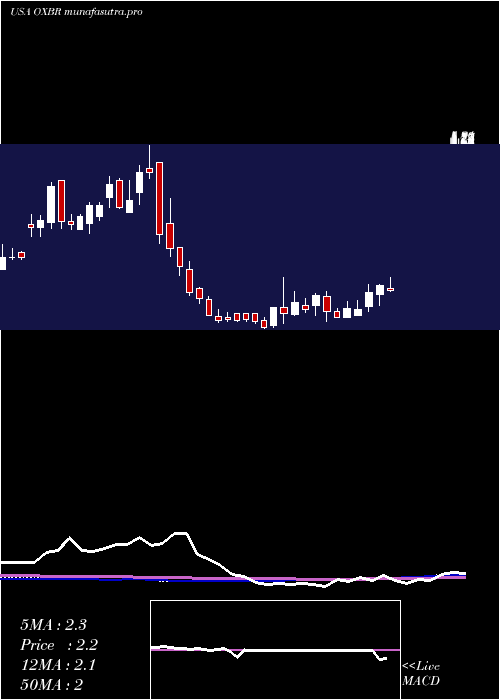
Weekly price and charts OxbridgeRe Strong weekly Stock price targets for OxbridgeRe OXBR are 1.33 and 1.46 | Weekly Target 1 | 1.23 | | Weekly Target 2 | 1.29 | | Weekly Target 3 | 1.3566666666667 | | Weekly Target 4 | 1.42 | | Weekly Target 5 | 1.49 |
Weekly price and volumes for Oxbridge Re
| Date |
Closing |
Open |
Range |
Volume |
Thu 04 December 2025 |
1.36 (-2.16%) |
1.33 |
1.29 - 1.42 |
0.4201 times |
Fri 28 November 2025 |
1.39 (8.59%) |
1.31 |
1.28 - 1.50 |
0.562 times |
Fri 21 November 2025 |
1.28 (2.4%) |
1.25 |
1.12 - 1.31 |
1.5842 times |
Fri 14 November 2025 |
1.25 (-5.3%) |
1.34 |
1.21 - 1.45 |
1.1911 times |
Fri 07 November 2025 |
1.32 (-13.16%) |
1.56 |
1.30 - 1.56 |
0.8457 times |
Fri 31 October 2025 |
1.52 (0%) |
1.57 |
1.52 - 1.57 |
0.0574 times |
Fri 31 October 2025 |
1.52 (-11.11%) |
1.73 |
1.52 - 1.75 |
0.4702 times |
Fri 24 October 2025 |
1.71 (0%) |
1.72 |
1.51 - 1.82 |
1.1153 times |
Fri 17 October 2025 |
1.71 (-10%) |
1.86 |
1.68 - 1.87 |
1.059 times |
Fri 10 October 2025 |
1.90 (2.7%) |
1.91 |
1.80 - 2.13 |
2.6951 times |
Fri 03 October 2025 |
1.85 (-5.61%) |
2.05 |
1.75 - 2.09 |
2.6749 times |
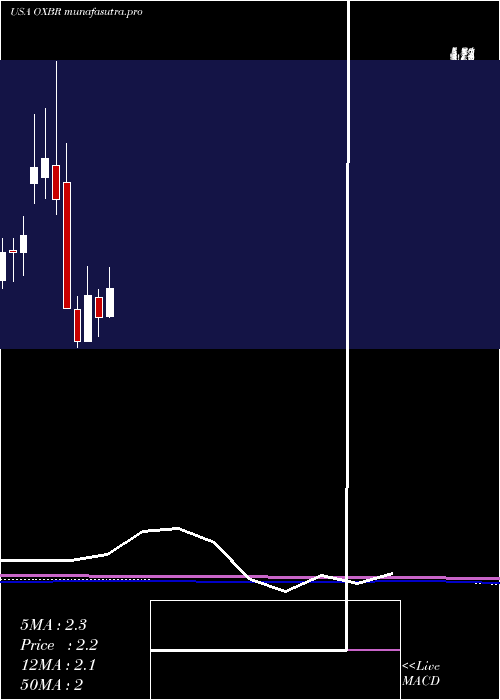
Monthly price and charts OxbridgeRe Strong monthly Stock price targets for OxbridgeRe OXBR are 1.33 and 1.46 | Monthly Target 1 | 1.23 | | Monthly Target 2 | 1.29 | | Monthly Target 3 | 1.3566666666667 | | Monthly Target 4 | 1.42 | | Monthly Target 5 | 1.49 |
Monthly price and volumes Oxbridge Re
| Date |
Closing |
Open |
Range |
Volume |
Thu 04 December 2025 |
1.36 (-2.16%) |
1.33 |
1.29 - 1.42 |
0.0294 times |
Fri 28 November 2025 |
1.39 (-8.55%) |
1.56 |
1.12 - 1.56 |
0.2925 times |
Fri 31 October 2025 |
1.52 (-15.08%) |
1.82 |
1.51 - 2.13 |
0.451 times |
Tue 30 September 2025 |
1.79 (-16.74%) |
2.14 |
1.75 - 2.86 |
1.2186 times |
Fri 29 August 2025 |
2.15 (18.78%) |
1.76 |
1.55 - 2.48 |
0.763 times |
Thu 31 July 2025 |
1.81 (4.02%) |
1.76 |
1.74 - 2.59 |
3.1821 times |
Mon 30 June 2025 |
1.74 (-17.14%) |
2.07 |
1.45 - 2.19 |
1.3206 times |
Fri 30 May 2025 |
2.10 (54.41%) |
1.36 |
1.36 - 2.55 |
2.1427 times |
Wed 30 April 2025 |
1.36 (-28.04%) |
1.87 |
1.27 - 2.08 |
0.1976 times |
Mon 31 March 2025 |
1.89 (-47.79%) |
3.89 |
1.88 - 4.50 |
0.4027 times |
Fri 28 February 2025 |
3.62 (-15.22%) |
4.16 |
3.38 - 5.81 |
0.5359 times |
DMA SMA EMA moving averages of Oxbridge Re OXBR
DMA (daily moving average) of Oxbridge Re OXBR
| DMA period | DMA value | | 5 day DMA | 1.35 | | 12 day DMA | 1.33 | | 20 day DMA | 1.32 | | 35 day DMA | 1.44 | | 50 day DMA | 1.58 | | 100 day DMA | 1.8 | | 150 day DMA | 1.81 | | 200 day DMA | 1.99 | EMA (exponential moving average) of Oxbridge Re OXBR
| EMA period | EMA current | EMA prev | EMA prev2 | | 5 day EMA | 1.35 | 1.35 | 1.35 | | 12 day EMA | 1.35 | 1.35 | 1.35 | | 20 day EMA | 1.38 | 1.38 | 1.38 | | 35 day EMA | 1.47 | 1.48 | 1.49 | | 50 day EMA | 1.62 | 1.63 | 1.64 |
SMA (simple moving average) of Oxbridge Re OXBR
| SMA period | SMA current | SMA prev | SMA prev2 | | 5 day SMA | 1.35 | 1.36 | 1.39 | | 12 day SMA | 1.33 | 1.32 | 1.31 | | 20 day SMA | 1.32 | 1.32 | 1.33 | | 35 day SMA | 1.44 | 1.46 | 1.47 | | 50 day SMA | 1.58 | 1.59 | 1.6 | | 100 day SMA | 1.8 | 1.81 | 1.82 | | 150 day SMA | 1.81 | 1.81 | 1.81 | | 200 day SMA | 1.99 | 2.01 | 2.02 |
|
|
