OhioValley OVBC full analysis,charts,indicators,moving averages,SMA,DMA,EMA,ADX,MACD,RSIOhio Valley OVBC WideScreen charts, DMA,SMA,EMA technical analysis, forecast prediction, by indicators ADX,MACD,RSI,CCI USA stock exchange
operates under Finance sector & deals in Major Banks
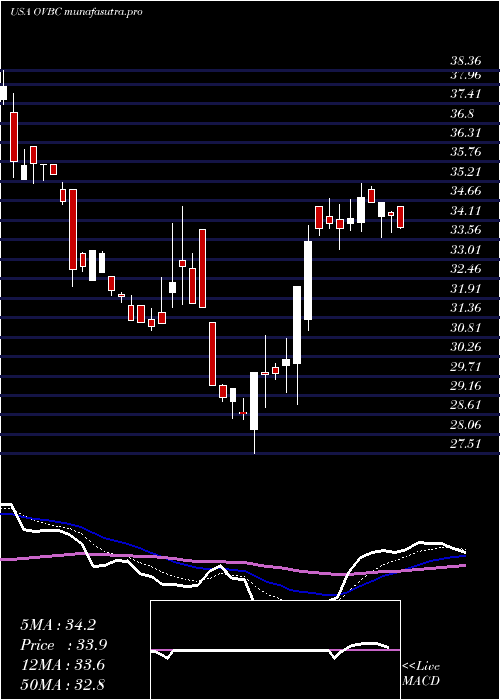
Daily price and charts and targets OhioValley Strong Daily Stock price targets for OhioValley OVBC are 36.24 and 36.45 | Daily Target 1 | 36.2 | | Daily Target 2 | 36.27 | | Daily Target 3 | 36.41 | | Daily Target 4 | 36.48 | | Daily Target 5 | 36.62 |
Daily price and volume Ohio Valley
| Date |
Closing |
Open |
Range |
Volume |
Mon 20 October 2025 |
36.34 (1.14%) |
36.55 |
36.34 - 36.55 |
0.4655 times |
Fri 17 October 2025 |
35.93 (1.27%) |
35.14 |
35.14 - 36.03 |
0.8448 times |
Thu 16 October 2025 |
35.48 (-2.71%) |
36.15 |
35.43 - 36.15 |
0.8276 times |
Wed 15 October 2025 |
36.47 (1.22%) |
36.13 |
35.90 - 36.47 |
1.5345 times |
Tue 14 October 2025 |
36.03 (1.95%) |
35.71 |
35.60 - 36.03 |
0.7241 times |
Mon 13 October 2025 |
35.34 (1.46%) |
34.85 |
34.85 - 35.49 |
1.5172 times |
Fri 10 October 2025 |
34.83 (-1.42%) |
34.85 |
34.50 - 35.21 |
0.9138 times |
Thu 09 October 2025 |
35.33 (-1.62%) |
35.99 |
35.33 - 35.99 |
0.6379 times |
Wed 08 October 2025 |
35.91 (-0.53%) |
36.00 |
35.91 - 36.05 |
0.8966 times |
Tue 07 October 2025 |
36.10 (-0.11%) |
36.10 |
36.00 - 36.29 |
1.6379 times |
Mon 06 October 2025 |
36.14 (0.06%) |
36.13 |
35.93 - 36.20 |
1.0517 times |
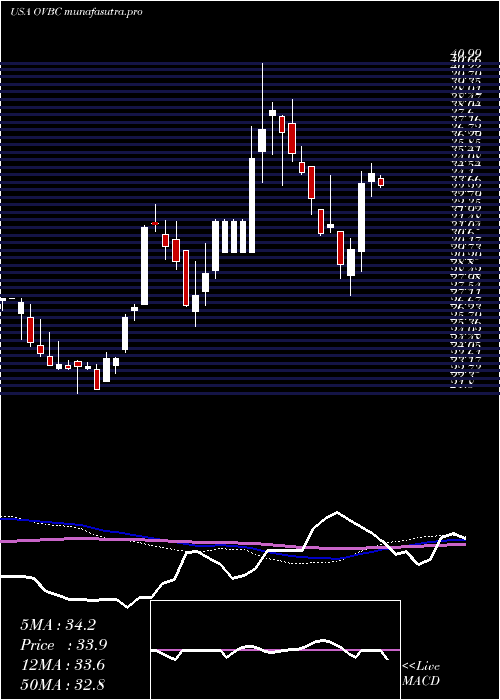
Weekly price and charts OhioValley Strong weekly Stock price targets for OhioValley OVBC are 36.24 and 36.45 | Weekly Target 1 | 36.2 | | Weekly Target 2 | 36.27 | | Weekly Target 3 | 36.41 | | Weekly Target 4 | 36.48 | | Weekly Target 5 | 36.62 |
Weekly price and volumes for Ohio Valley
| Date |
Closing |
Open |
Range |
Volume |
Mon 20 October 2025 |
36.34 (1.14%) |
36.55 |
36.34 - 36.55 |
0.0651 times |
Fri 17 October 2025 |
35.93 (3.16%) |
34.85 |
34.85 - 36.47 |
0.762 times |
Fri 10 October 2025 |
34.83 (-3.57%) |
36.13 |
34.50 - 36.29 |
0.7186 times |
Fri 03 October 2025 |
36.12 (-4.92%) |
37.95 |
35.25 - 37.95 |
0.523 times |
Fri 26 September 2025 |
37.99 (-2.46%) |
39.03 |
37.60 - 39.62 |
1.3649 times |
Fri 19 September 2025 |
38.95 (5.41%) |
37.33 |
36.75 - 39.30 |
2.1558 times |
Fri 12 September 2025 |
36.95 (1.23%) |
36.80 |
32.97 - 37.23 |
1.307 times |
Fri 05 September 2025 |
36.50 (-1.35%) |
36.97 |
36.00 - 37.55 |
1.348 times |
Fri 29 August 2025 |
37.00 (0%) |
36.51 |
35.80 - 37.00 |
0.4702 times |
Fri 29 August 2025 |
37.00 (1.96%) |
36.80 |
35.44 - 37.00 |
1.2853 times |
Fri 22 August 2025 |
36.29 (4.52%) |
34.90 |
34.87 - 36.87 |
1.1165 times |
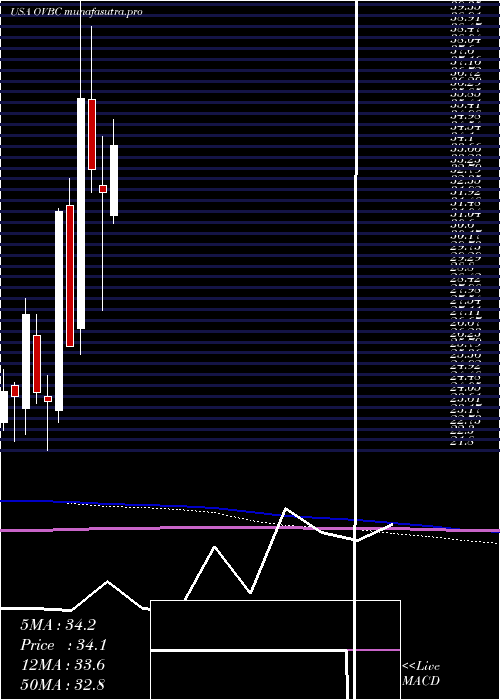
Monthly price and charts OhioValley Strong monthly Stock price targets for OhioValley OVBC are 34.27 and 36.57 | Monthly Target 1 | 33.58 | | Monthly Target 2 | 34.96 | | Monthly Target 3 | 35.88 | | Monthly Target 4 | 37.26 | | Monthly Target 5 | 38.18 |
Monthly price and volumes Ohio Valley
| Date |
Closing |
Open |
Range |
Volume |
Mon 20 October 2025 |
36.34 (-1.73%) |
36.80 |
34.50 - 36.80 |
0.3057 times |
Tue 30 September 2025 |
36.98 (-0.05%) |
36.97 |
32.97 - 39.62 |
1.0715 times |
Fri 29 August 2025 |
37.00 (14.76%) |
32.18 |
31.61 - 37.00 |
0.8822 times |
Thu 31 July 2025 |
32.24 (0.03%) |
31.31 |
31.00 - 35.34 |
0.803 times |
Mon 30 June 2025 |
32.23 (-2.89%) |
32.54 |
27.51 - 34.50 |
2.4963 times |
Fri 30 May 2025 |
33.19 (-7.86%) |
35.97 |
32.24 - 38.92 |
0.7102 times |
Wed 30 April 2025 |
36.02 (38.27%) |
26.78 |
25.75 - 40.99 |
1.0693 times |
Mon 31 March 2025 |
26.05 (-17.3%) |
31.73 |
26.05 - 32.81 |
1.4603 times |
Fri 28 February 2025 |
31.50 (32.08%) |
23.50 |
23.00 - 31.59 |
0.5772 times |
Fri 31 January 2025 |
23.85 (-1.49%) |
24.03 |
21.86 - 24.87 |
0.6244 times |
Tue 31 December 2024 |
24.21 (-11.51%) |
26.50 |
23.75 - 27.35 |
0.466 times |
DMA SMA EMA moving averages of Ohio Valley OVBC
DMA (daily moving average) of Ohio Valley OVBC
| DMA period | DMA value | | 5 day DMA | 36.05 | | 12 day DMA | 35.84 | | 20 day DMA | 36.46 | | 35 day DMA | 36.76 | | 50 day DMA | 36.52 | | 100 day DMA | 34.67 | | 150 day DMA | 34.21 | | 200 day DMA | 32.13 | EMA (exponential moving average) of Ohio Valley OVBC
| EMA period | EMA current | EMA prev | EMA prev2 | | 5 day EMA | 36 | 35.83 | 35.78 | | 12 day EMA | 36.06 | 36.01 | 36.02 | | 20 day EMA | 36.24 | 36.23 | 36.26 | | 35 day EMA | 36.24 | 36.23 | 36.25 | | 50 day EMA | 36.31 | 36.31 | 36.33 |
SMA (simple moving average) of Ohio Valley OVBC
| SMA period | SMA current | SMA prev | SMA prev2 | | 5 day SMA | 36.05 | 35.85 | 35.63 | | 12 day SMA | 35.84 | 35.81 | 35.86 | | 20 day SMA | 36.46 | 36.55 | 36.7 | | 35 day SMA | 36.76 | 36.78 | 36.81 | | 50 day SMA | 36.52 | 36.5 | 36.47 | | 100 day SMA | 34.67 | 34.63 | 34.62 | | 150 day SMA | 34.21 | 34.17 | 34.13 | | 200 day SMA | 32.13 | 32.07 | 32.01 |
|
|
