OrrstownFinancial ORRF full analysis,charts,indicators,moving averages,SMA,DMA,EMA,ADX,MACD,RSIOrrstown Financial ORRF WideScreen charts, DMA,SMA,EMA technical analysis, forecast prediction, by indicators ADX,MACD,RSI,CCI USA stock exchange
operates under Finance sector & deals in Major Banks
Daily price and charts and targets OrrstownFinancial Strong Daily Stock price targets for OrrstownFinancial ORRF are 36.95 and 37.4 | Daily Target 1 | 36.62 | | Daily Target 2 | 36.82 | | Daily Target 3 | 37.073333333333 | | Daily Target 4 | 37.27 | | Daily Target 5 | 37.52 |
Daily price and volume Orrstown Financial
| Date |
Closing |
Open |
Range |
Volume |
Thu 04 December 2025 |
37.01 (0.27%) |
36.95 |
36.88 - 37.33 |
1.1457 times |
Wed 03 December 2025 |
36.91 (1.91%) |
36.29 |
36.25 - 37.15 |
1.165 times |
Tue 02 December 2025 |
36.22 (-0.19%) |
36.47 |
36.11 - 36.61 |
0.7904 times |
Mon 01 December 2025 |
36.29 (1.48%) |
35.49 |
35.49 - 36.44 |
1.3743 times |
Fri 28 November 2025 |
35.76 (-0.36%) |
35.88 |
35.64 - 36.07 |
0.3474 times |
Wed 26 November 2025 |
35.89 (-0.55%) |
36.06 |
35.77 - 36.19 |
0.6665 times |
Tue 25 November 2025 |
36.09 (2.73%) |
35.74 |
35.20 - 36.22 |
1.4396 times |
Mon 24 November 2025 |
35.13 (-0.34%) |
35.21 |
34.85 - 35.69 |
0.4769 times |
Fri 21 November 2025 |
35.25 (4.6%) |
33.75 |
33.75 - 35.49 |
2.0227 times |
Thu 20 November 2025 |
33.70 (0.39%) |
34.00 |
33.60 - 34.56 |
0.5713 times |
Wed 19 November 2025 |
33.57 (0%) |
33.50 |
33.33 - 33.78 |
0.4879 times |
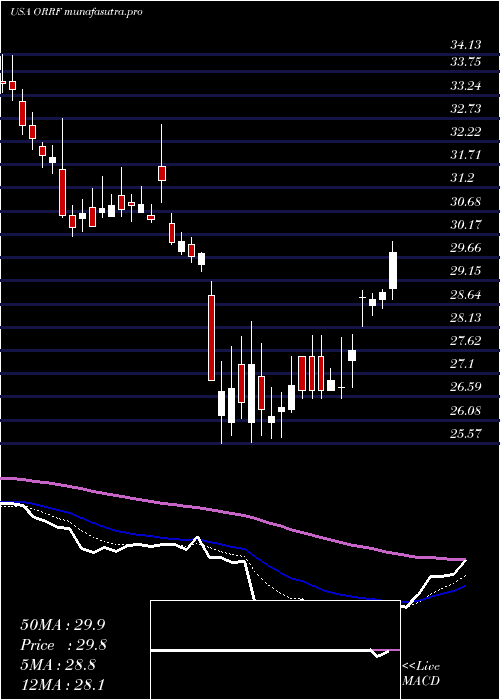
Weekly price and charts OrrstownFinancial Strong weekly Stock price targets for OrrstownFinancial ORRF are 36.25 and 38.09 | Weekly Target 1 | 34.77 | | Weekly Target 2 | 35.89 | | Weekly Target 3 | 36.61 | | Weekly Target 4 | 37.73 | | Weekly Target 5 | 38.45 |
Weekly price and volumes for Orrstown Financial
| Date |
Closing |
Open |
Range |
Volume |
Thu 04 December 2025 |
37.01 (3.5%) |
35.49 |
35.49 - 37.33 |
1.7255 times |
Fri 28 November 2025 |
35.76 (1.45%) |
35.21 |
34.85 - 36.22 |
1.1298 times |
Fri 21 November 2025 |
35.25 (2.35%) |
34.40 |
33.33 - 35.49 |
1.6475 times |
Fri 14 November 2025 |
34.44 (2.04%) |
34.08 |
33.77 - 34.94 |
0.6536 times |
Fri 07 November 2025 |
33.75 (1.41%) |
33.34 |
33.15 - 34.27 |
0.7607 times |
Fri 31 October 2025 |
33.28 (0%) |
33.22 |
32.69 - 33.37 |
0.1531 times |
Fri 31 October 2025 |
33.28 (-3.84%) |
34.66 |
32.69 - 34.93 |
1.0696 times |
Fri 24 October 2025 |
34.61 (7.18%) |
32.44 |
32.30 - 35.51 |
1.1523 times |
Fri 17 October 2025 |
32.29 (-0.12%) |
32.66 |
31.87 - 34.49 |
1.0213 times |
Fri 10 October 2025 |
32.33 (-4.15%) |
34.10 |
32.29 - 35.25 |
0.6866 times |
Fri 03 October 2025 |
33.73 (-2.51%) |
34.65 |
33.14 - 35.55 |
0.6439 times |
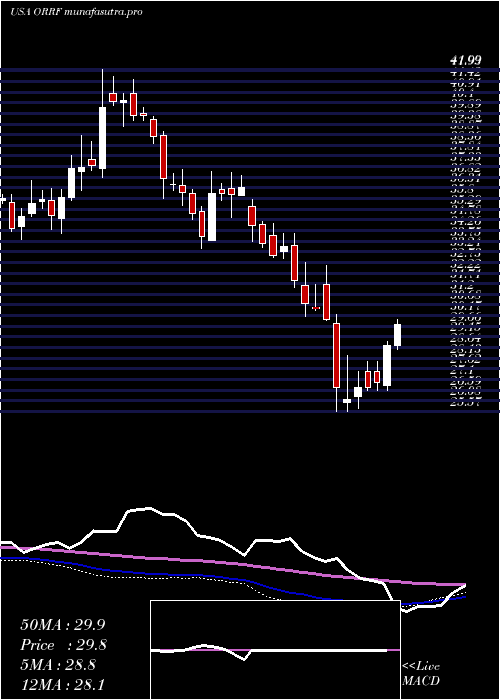
Monthly price and charts OrrstownFinancial Strong monthly Stock price targets for OrrstownFinancial ORRF are 36.25 and 38.09 | Monthly Target 1 | 34.77 | | Monthly Target 2 | 35.89 | | Monthly Target 3 | 36.61 | | Monthly Target 4 | 37.73 | | Monthly Target 5 | 38.45 |
Monthly price and volumes Orrstown Financial
| Date |
Closing |
Open |
Range |
Volume |
Thu 04 December 2025 |
37.01 (3.5%) |
35.49 |
35.49 - 37.33 |
0.4074 times |
Fri 28 November 2025 |
35.76 (7.45%) |
33.34 |
33.15 - 36.22 |
0.9898 times |
Fri 31 October 2025 |
33.28 (-2.06%) |
33.85 |
31.87 - 35.51 |
1.0442 times |
Tue 30 September 2025 |
33.98 (-2.5%) |
34.53 |
33.60 - 35.96 |
0.8187 times |
Fri 29 August 2025 |
34.85 (6.06%) |
32.59 |
31.51 - 35.14 |
1.0611 times |
Thu 31 July 2025 |
32.86 (3.24%) |
31.59 |
31.59 - 37.75 |
1.4644 times |
Mon 30 June 2025 |
31.83 (5.89%) |
30.01 |
29.39 - 32.21 |
1.0407 times |
Fri 30 May 2025 |
30.06 (0.3%) |
29.98 |
29.31 - 31.92 |
0.8128 times |
Wed 30 April 2025 |
29.97 (-0.13%) |
29.95 |
25.57 - 30.35 |
1.3469 times |
Mon 31 March 2025 |
30.01 (-10.42%) |
33.54 |
29.74 - 34.11 |
1.0141 times |
Fri 28 February 2025 |
33.50 (-7.82%) |
35.41 |
32.91 - 35.73 |
0.9546 times |

DMA SMA EMA moving averages of Orrstown Financial ORRF
DMA (daily moving average) of Orrstown Financial ORRF
| DMA period | DMA value | | 5 day DMA | 36.44 | | 12 day DMA | 35.45 | | 20 day DMA | 34.91 | | 35 day DMA | 34.33 | | 50 day DMA | 34.15 | | 100 day DMA | 34.14 | | 150 day DMA | 33.13 | | 200 day DMA | 32.35 | EMA (exponential moving average) of Orrstown Financial ORRF
| EMA period | EMA current | EMA prev | EMA prev2 | | 5 day EMA | 36.5 | 36.24 | 35.91 | | 12 day EMA | 35.75 | 35.52 | 35.27 | | 20 day EMA | 35.25 | 35.06 | 34.86 | | 35 day EMA | 34.79 | 34.66 | 34.53 | | 50 day EMA | 34.46 | 34.36 | 34.26 |
SMA (simple moving average) of Orrstown Financial ORRF
| SMA period | SMA current | SMA prev | SMA prev2 | | 5 day SMA | 36.44 | 36.21 | 36.05 | | 12 day SMA | 35.45 | 35.17 | 34.96 | | 20 day SMA | 34.91 | 34.76 | 34.59 | | 35 day SMA | 34.33 | 34.23 | 34.15 | | 50 day SMA | 34.15 | 34.1 | 34.06 | | 100 day SMA | 34.14 | 34.09 | 34.06 | | 150 day SMA | 33.13 | 33.08 | 33.04 | | 200 day SMA | 32.35 | 32.33 | 32.32 |
|
|
