OrganogenesisHoldings ORGO full analysis,charts,indicators,moving averages,SMA,DMA,EMA,ADX,MACD,RSIOrganogenesis Holdings ORGO WideScreen charts, DMA,SMA,EMA technical analysis, forecast prediction, by indicators ADX,MACD,RSI,CCI USA stock exchange
operates under Health Care sector & deals in Major Pharmaceuticals
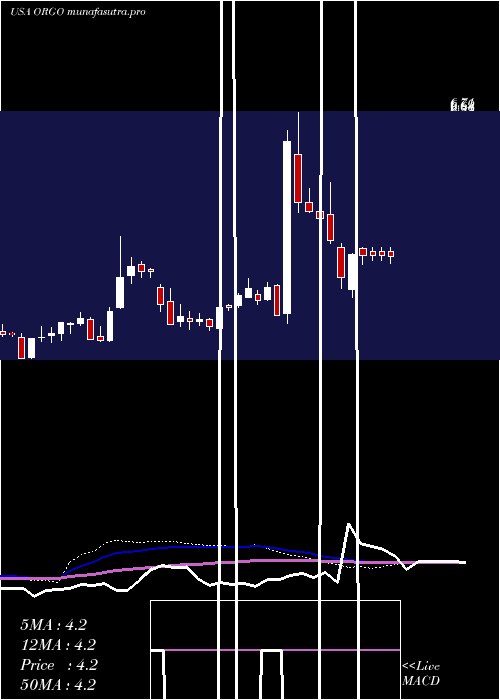
Daily price and charts and targets OrganogenesisHoldings Strong Daily Stock price targets for OrganogenesisHoldings ORGO are 4.84 and 4.96 | Daily Target 1 | 4.81 | | Daily Target 2 | 4.87 | | Daily Target 3 | 4.93 | | Daily Target 4 | 4.99 | | Daily Target 5 | 5.05 |
Daily price and volume Organogenesis Holdings
| Date |
Closing |
Open |
Range |
Volume |
Thu 04 December 2025 |
4.93 (-1.2%) |
4.97 |
4.87 - 4.99 |
0.4077 times |
Wed 03 December 2025 |
4.99 (-0.6%) |
5.04 |
4.98 - 5.10 |
0.6804 times |
Tue 02 December 2025 |
5.02 (-1.18%) |
5.11 |
4.92 - 5.19 |
1.0329 times |
Mon 01 December 2025 |
5.08 (-1.93%) |
5.18 |
5.03 - 5.21 |
1.0498 times |
Fri 28 November 2025 |
5.18 (-4.43%) |
5.34 |
5.11 - 5.43 |
0.3411 times |
Wed 26 November 2025 |
5.42 (2.65%) |
5.28 |
5.15 - 5.44 |
0.8068 times |
Tue 25 November 2025 |
5.28 (-2.04%) |
5.48 |
5.18 - 5.57 |
0.7142 times |
Mon 24 November 2025 |
5.39 (-3.58%) |
5.54 |
5.24 - 5.65 |
1.5725 times |
Fri 21 November 2025 |
5.59 (9.18%) |
5.14 |
5.13 - 5.69 |
2.0678 times |
Thu 20 November 2025 |
5.12 (-0.19%) |
5.53 |
5.12 - 5.83 |
1.3268 times |
Wed 19 November 2025 |
5.13 (-7.07%) |
5.52 |
5.09 - 5.56 |
1.2499 times |

Weekly price and charts OrganogenesisHoldings Strong weekly Stock price targets for OrganogenesisHoldings ORGO are 4.73 and 5.07 | Weekly Target 1 | 4.66 | | Weekly Target 2 | 4.8 | | Weekly Target 3 | 5.0033333333333 | | Weekly Target 4 | 5.14 | | Weekly Target 5 | 5.34 |
Weekly price and volumes for Organogenesis Holdings
| Date |
Closing |
Open |
Range |
Volume |
Thu 04 December 2025 |
4.93 (-4.83%) |
5.18 |
4.87 - 5.21 |
0.5633 times |
Fri 28 November 2025 |
5.18 (-7.33%) |
5.54 |
5.11 - 5.65 |
0.6101 times |
Fri 21 November 2025 |
5.59 (-8.36%) |
6.09 |
5.09 - 6.20 |
1.2843 times |
Fri 14 November 2025 |
6.10 (8.35%) |
5.78 |
5.71 - 7.08 |
1.3747 times |
Fri 07 November 2025 |
5.63 (32.47%) |
3.99 |
3.84 - 6.20 |
4.4548 times |
Fri 31 October 2025 |
4.25 (0%) |
4.23 |
4.15 - 4.28 |
0.0435 times |
Fri 31 October 2025 |
4.25 (-0.23%) |
4.29 |
4.13 - 4.39 |
0.7146 times |
Fri 24 October 2025 |
4.26 (5.45%) |
4.10 |
4.02 - 4.39 |
0.2935 times |
Fri 17 October 2025 |
4.04 (2.02%) |
4.02 |
3.84 - 4.21 |
0.2854 times |
Fri 10 October 2025 |
3.96 (-7.69%) |
4.35 |
3.89 - 4.35 |
0.3759 times |
Fri 03 October 2025 |
4.29 (4.63%) |
4.12 |
3.99 - 4.41 |
0.6148 times |
Monthly price and charts OrganogenesisHoldings Strong monthly Stock price targets for OrganogenesisHoldings ORGO are 4.73 and 5.07 | Monthly Target 1 | 4.66 | | Monthly Target 2 | 4.8 | | Monthly Target 3 | 5.0033333333333 | | Monthly Target 4 | 5.14 | | Monthly Target 5 | 5.34 |
Monthly price and volumes Organogenesis Holdings
| Date |
Closing |
Open |
Range |
Volume |
Thu 04 December 2025 |
4.93 (-4.83%) |
5.18 |
4.87 - 5.21 |
0.1659 times |
Fri 28 November 2025 |
5.18 (21.88%) |
3.99 |
3.84 - 7.08 |
2.2743 times |
Fri 31 October 2025 |
4.25 (0.71%) |
4.25 |
3.84 - 4.41 |
0.605 times |
Tue 30 September 2025 |
4.22 (-18.06%) |
5.03 |
3.94 - 5.20 |
0.8339 times |
Fri 29 August 2025 |
5.15 (11.47%) |
4.55 |
3.58 - 5.17 |
0.5792 times |
Thu 31 July 2025 |
4.62 (26.23%) |
3.63 |
3.59 - 5.15 |
0.7573 times |
Mon 30 June 2025 |
3.66 (33.58%) |
2.75 |
2.61 - 3.77 |
0.8395 times |
Fri 30 May 2025 |
2.74 (-44.2%) |
4.88 |
2.73 - 5.55 |
1.4612 times |
Wed 30 April 2025 |
4.91 (13.66%) |
4.33 |
3.52 - 4.93 |
1.2634 times |
Mon 31 March 2025 |
4.32 (-30.43%) |
5.99 |
4.24 - 6.71 |
1.2203 times |
Fri 28 February 2025 |
6.21 (68.75%) |
3.57 |
3.07 - 6.40 |
2.7113 times |

DMA SMA EMA moving averages of Organogenesis Holdings ORGO
DMA (daily moving average) of Organogenesis Holdings ORGO
| DMA period | DMA value | | 5 day DMA | 5.04 | | 12 day DMA | 5.22 | | 20 day DMA | 5.5 | | 35 day DMA | 4.91 | | 50 day DMA | 4.69 | | 100 day DMA | 4.73 | | 150 day DMA | 4.35 | | 200 day DMA | 4.38 | EMA (exponential moving average) of Organogenesis Holdings ORGO
| EMA period | EMA current | EMA prev | EMA prev2 | | 5 day EMA | 5.05 | 5.11 | 5.17 | | 12 day EMA | 5.19 | 5.24 | 5.28 | | 20 day EMA | 5.17 | 5.2 | 5.22 | | 35 day EMA | 5.05 | 5.06 | 5.06 | | 50 day EMA | 4.73 | 4.72 | 4.71 |
SMA (simple moving average) of Organogenesis Holdings ORGO
| SMA period | SMA current | SMA prev | SMA prev2 | | 5 day SMA | 5.04 | 5.14 | 5.2 | | 12 day SMA | 5.22 | 5.31 | 5.4 | | 20 day SMA | 5.5 | 5.45 | 5.4 | | 35 day SMA | 4.91 | 4.89 | 4.86 | | 50 day SMA | 4.69 | 4.69 | 4.68 | | 100 day SMA | 4.73 | 4.72 | 4.71 | | 150 day SMA | 4.35 | 4.35 | 4.35 | | 200 day SMA | 4.38 | 4.38 | 4.37 |
|
|
