OrchidIsland ORC full analysis,charts,indicators,moving averages,SMA,DMA,EMA,ADX,MACD,RSIOrchid Island ORC WideScreen charts, DMA,SMA,EMA technical analysis, forecast prediction, by indicators ADX,MACD,RSI,CCI USA stock exchange
operates under Consumer Services sector & deals in Real Estate Investment Trusts
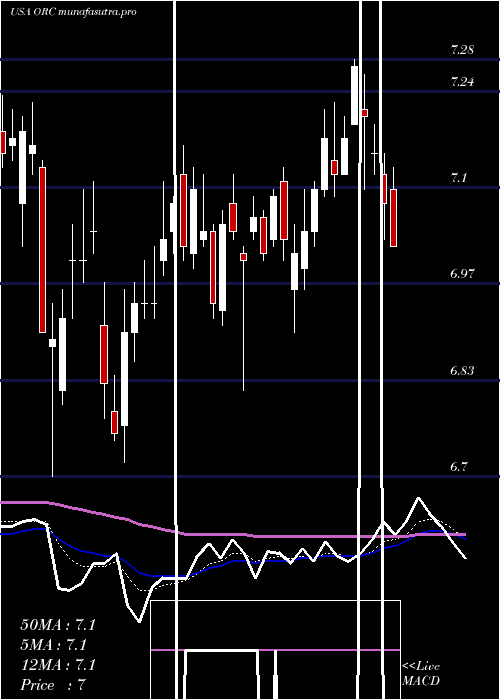
Daily price and charts and targets OrchidIsland Strong Daily Stock price targets for OrchidIsland ORC are 7.42 and 7.63 | Daily Target 1 | 7.24 | | Daily Target 2 | 7.38 | | Daily Target 3 | 7.4533333333333 | | Daily Target 4 | 7.59 | | Daily Target 5 | 7.66 |
Daily price and volume Orchid Island
| Date |
Closing |
Open |
Range |
Volume |
Mon 20 October 2025 |
7.51 (2.46%) |
7.39 |
7.32 - 7.53 |
0.8646 times |
Fri 17 October 2025 |
7.33 (0.41%) |
7.25 |
7.22 - 7.34 |
0.6839 times |
Thu 16 October 2025 |
7.30 (0.55%) |
7.26 |
7.26 - 7.36 |
1.1414 times |
Wed 15 October 2025 |
7.26 (-0.14%) |
7.30 |
7.22 - 7.31 |
0.9165 times |
Tue 14 October 2025 |
7.27 (1.11%) |
7.15 |
7.15 - 7.31 |
1.1569 times |
Mon 13 October 2025 |
7.19 (0.7%) |
7.11 |
7.09 - 7.21 |
0.8257 times |
Tue 07 October 2025 |
7.14 (0.71%) |
7.07 |
7.04 - 7.16 |
0.9859 times |
Mon 06 October 2025 |
7.09 (-0.56%) |
7.05 |
7.02 - 7.23 |
0.7511 times |
Fri 03 October 2025 |
7.13 (-0.28%) |
7.18 |
7.12 - 7.23 |
1.0735 times |
Thu 02 October 2025 |
7.15 (-0.56%) |
7.19 |
7.10 - 7.24 |
1.6003 times |
Wed 01 October 2025 |
7.19 (2.57%) |
7.01 |
7.00 - 7.20 |
1.7063 times |
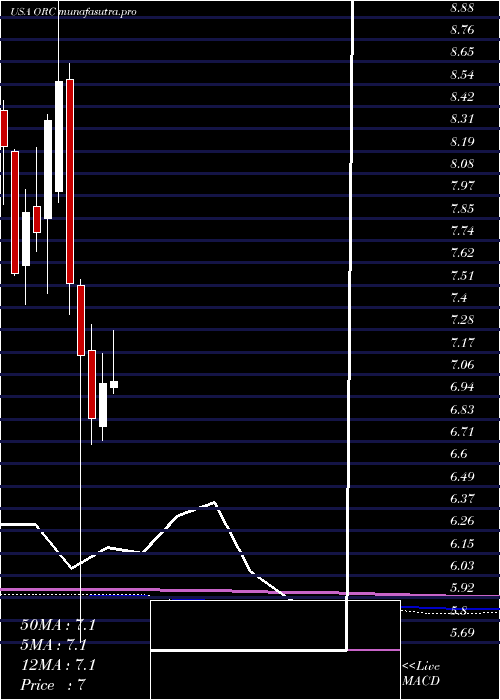
Weekly price and charts OrchidIsland Strong weekly Stock price targets for OrchidIsland ORC are 7.42 and 7.63 | Weekly Target 1 | 7.24 | | Weekly Target 2 | 7.38 | | Weekly Target 3 | 7.4533333333333 | | Weekly Target 4 | 7.59 | | Weekly Target 5 | 7.66 |
Weekly price and volumes for Orchid Island
| Date |
Closing |
Open |
Range |
Volume |
Mon 20 October 2025 |
7.51 (2.46%) |
7.39 |
7.32 - 7.53 |
0.2155 times |
Fri 17 October 2025 |
7.33 (2.66%) |
7.11 |
7.09 - 7.36 |
1.1775 times |
Tue 07 October 2025 |
7.14 (0.14%) |
7.05 |
7.02 - 7.23 |
0.4329 times |
Fri 03 October 2025 |
7.13 (1.13%) |
7.05 |
6.91 - 7.24 |
1.7842 times |
Fri 26 September 2025 |
7.05 (0.71%) |
7.01 |
6.83 - 7.11 |
1.3162 times |
Fri 19 September 2025 |
7.00 (-1.27%) |
7.12 |
6.95 - 7.22 |
1.3391 times |
Fri 12 September 2025 |
7.09 (-1.39%) |
7.17 |
7.05 - 7.30 |
0.9565 times |
Fri 05 September 2025 |
7.19 (1.84%) |
6.99 |
6.95 - 7.26 |
1.0552 times |
Fri 29 August 2025 |
7.06 (0%) |
7.00 |
6.97 - 7.09 |
0.3515 times |
Fri 29 August 2025 |
7.06 (-0.98%) |
7.14 |
6.97 - 7.16 |
1.3714 times |
Fri 22 August 2025 |
7.13 (-0.28%) |
7.16 |
7.03 - 7.20 |
1.0456 times |
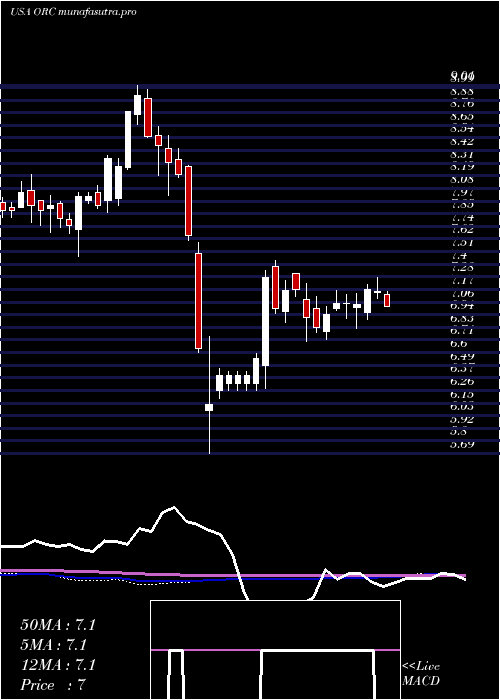
Monthly price and charts OrchidIsland Strong monthly Stock price targets for OrchidIsland ORC are 7.26 and 7.79 | Monthly Target 1 | 6.82 | | Monthly Target 2 | 7.16 | | Monthly Target 3 | 7.3466666666667 | | Monthly Target 4 | 7.69 | | Monthly Target 5 | 7.88 |
Monthly price and volumes Orchid Island
| Date |
Closing |
Open |
Range |
Volume |
Mon 20 October 2025 |
7.51 (7.13%) |
7.01 |
7.00 - 7.53 |
0.7249 times |
Tue 30 September 2025 |
7.01 (-0.71%) |
6.99 |
6.83 - 7.30 |
1.3316 times |
Fri 29 August 2025 |
7.06 (1.44%) |
7.00 |
6.94 - 7.20 |
1.1422 times |
Thu 31 July 2025 |
6.96 (-0.71%) |
6.99 |
6.95 - 7.48 |
1.2121 times |
Mon 30 June 2025 |
7.01 (2.64%) |
6.79 |
6.72 - 7.16 |
0.9241 times |
Fri 30 May 2025 |
6.83 (-4.48%) |
7.18 |
6.70 - 7.31 |
1.0179 times |
Wed 30 April 2025 |
7.15 (-4.92%) |
7.51 |
5.69 - 7.54 |
1.2876 times |
Mon 31 March 2025 |
7.52 (-12.05%) |
8.56 |
7.36 - 8.64 |
0.8013 times |
Fri 28 February 2025 |
8.55 (2.4%) |
7.99 |
7.93 - 9.01 |
0.744 times |
Fri 31 January 2025 |
8.35 (7.33%) |
7.85 |
7.47 - 8.38 |
0.8143 times |
Tue 31 December 2024 |
7.78 (-1.27%) |
7.91 |
7.68 - 8.21 |
0.4807 times |
DMA SMA EMA moving averages of Orchid Island ORC
DMA (daily moving average) of Orchid Island ORC
| DMA period | DMA value | | 5 day DMA | 7.33 | | 12 day DMA | 7.21 | | 20 day DMA | 7.13 | | 35 day DMA | 7.12 | | 50 day DMA | 7.12 | | 100 day DMA | 7.09 | | 150 day DMA | 7.1 | | 200 day DMA | 7.38 | EMA (exponential moving average) of Orchid Island ORC
| EMA period | EMA current | EMA prev | EMA prev2 | | 5 day EMA | 7.35 | 7.27 | 7.24 | | 12 day EMA | 7.24 | 7.19 | 7.17 | | 20 day EMA | 7.2 | 7.17 | 7.15 | | 35 day EMA | 7.15 | 7.13 | 7.12 | | 50 day EMA | 7.14 | 7.13 | 7.12 |
SMA (simple moving average) of Orchid Island ORC
| SMA period | SMA current | SMA prev | SMA prev2 | | 5 day SMA | 7.33 | 7.27 | 7.23 | | 12 day SMA | 7.21 | 7.17 | 7.15 | | 20 day SMA | 7.13 | 7.11 | 7.1 | | 35 day SMA | 7.12 | 7.11 | 7.11 | | 50 day SMA | 7.12 | 7.11 | 7.1 | | 100 day SMA | 7.09 | 7.09 | 7.09 | | 150 day SMA | 7.1 | 7.11 | 7.11 | | 200 day SMA | 7.38 | 7.38 | 7.39 |
|
|
