OppenheimerHoldings OPY full analysis,charts,indicators,moving averages,SMA,DMA,EMA,ADX,MACD,RSIOppenheimer Holdings OPY WideScreen charts, DMA,SMA,EMA technical analysis, forecast prediction, by indicators ADX,MACD,RSI,CCI USA stock exchange
operates under Finance sector & deals in Investment Bankers Brokers Service
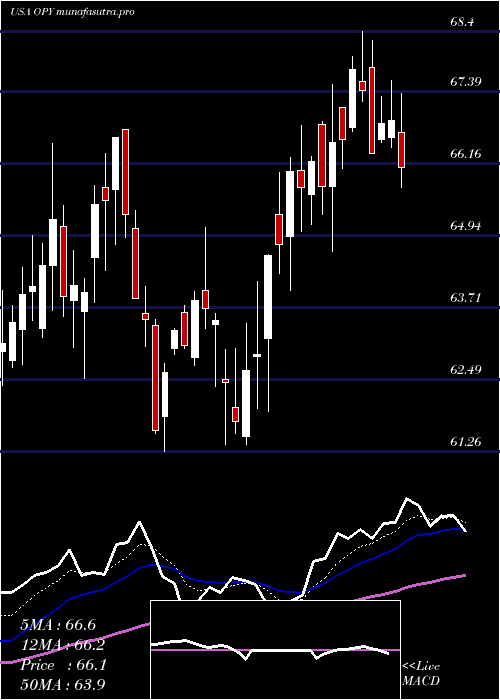
Daily price and charts and targets OppenheimerHoldings Strong Daily Stock price targets for OppenheimerHoldings OPY are 68.35 and 69.72 | Daily Target 1 | 67.39 | | Daily Target 2 | 67.94 | | Daily Target 3 | 68.76 | | Daily Target 4 | 69.31 | | Daily Target 5 | 70.13 |
Daily price and volume Oppenheimer Holdings
| Date |
Closing |
Open |
Range |
Volume |
Thu 04 December 2025 |
68.49 (-0.33%) |
68.21 |
68.21 - 69.58 |
0.7577 times |
Wed 03 December 2025 |
68.72 (2.58%) |
67.11 |
66.01 - 68.75 |
0.8669 times |
Tue 02 December 2025 |
66.99 (-0.5%) |
66.41 |
65.99 - 68.13 |
1.6495 times |
Mon 01 December 2025 |
67.33 (-1.03%) |
66.87 |
66.87 - 68.42 |
0.5925 times |
Fri 28 November 2025 |
68.03 (0.16%) |
68.00 |
67.59 - 68.38 |
0.3679 times |
Wed 26 November 2025 |
67.92 (0.41%) |
67.58 |
66.69 - 68.38 |
0.87 times |
Tue 25 November 2025 |
67.64 (1.38%) |
67.00 |
65.66 - 67.70 |
1.4312 times |
Mon 24 November 2025 |
66.72 (0.97%) |
66.32 |
66.32 - 67.39 |
0.8918 times |
Fri 21 November 2025 |
66.08 (0.69%) |
66.28 |
65.46 - 67.70 |
1.0914 times |
Thu 20 November 2025 |
65.63 (-0.89%) |
67.28 |
65.24 - 67.28 |
1.4811 times |
Wed 19 November 2025 |
66.22 (3.1%) |
64.14 |
64.05 - 66.60 |
1.2691 times |
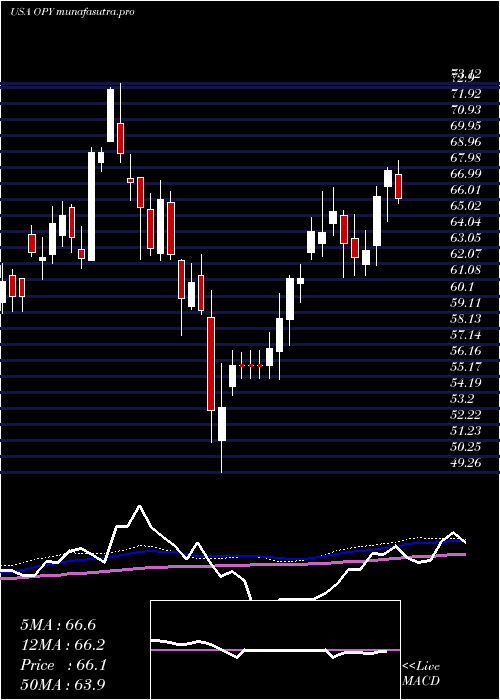
Weekly price and charts OppenheimerHoldings Strong weekly Stock price targets for OppenheimerHoldings OPY are 67.24 and 70.83 | Weekly Target 1 | 64.43 | | Weekly Target 2 | 66.46 | | Weekly Target 3 | 68.02 | | Weekly Target 4 | 70.05 | | Weekly Target 5 | 71.61 |
Weekly price and volumes for Oppenheimer Holdings
| Date |
Closing |
Open |
Range |
Volume |
Thu 04 December 2025 |
68.49 (0.68%) |
66.87 |
65.99 - 69.58 |
0.8221 times |
Fri 28 November 2025 |
68.03 (2.95%) |
66.32 |
65.66 - 68.38 |
0.7572 times |
Fri 21 November 2025 |
66.08 (-1.61%) |
66.60 |
63.81 - 67.70 |
1.4394 times |
Fri 14 November 2025 |
67.16 (-1.13%) |
67.79 |
67.01 - 70.21 |
1.2266 times |
Fri 07 November 2025 |
67.93 (-2.62%) |
66.74 |
66.28 - 69.11 |
1.0867 times |
Fri 31 October 2025 |
69.76 (0%) |
74.68 |
69.14 - 75.12 |
0.4621 times |
Fri 31 October 2025 |
69.76 (0.14%) |
69.95 |
67.73 - 75.12 |
1.4944 times |
Fri 24 October 2025 |
69.66 (3.72%) |
67.62 |
67.61 - 69.85 |
1.0104 times |
Fri 17 October 2025 |
67.16 (-5.19%) |
67.32 |
66.05 - 72.16 |
1.387 times |
Tue 07 October 2025 |
70.84 (-1.19%) |
72.39 |
70.43 - 72.70 |
0.3141 times |
Fri 03 October 2025 |
71.69 (-6.39%) |
76.41 |
69.91 - 77.04 |
1.4812 times |
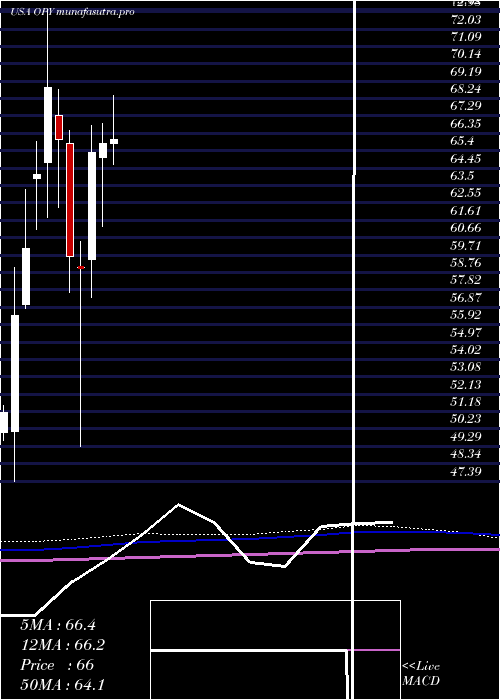
Monthly price and charts OppenheimerHoldings Strong monthly Stock price targets for OppenheimerHoldings OPY are 67.24 and 70.83 | Monthly Target 1 | 64.43 | | Monthly Target 2 | 66.46 | | Monthly Target 3 | 68.02 | | Monthly Target 4 | 70.05 | | Monthly Target 5 | 71.61 |
Monthly price and volumes Oppenheimer Holdings
| Date |
Closing |
Open |
Range |
Volume |
Thu 04 December 2025 |
68.49 (0.68%) |
66.87 |
65.99 - 69.58 |
0.1403 times |
Fri 28 November 2025 |
68.03 (-2.48%) |
66.74 |
63.81 - 70.21 |
0.7694 times |
Fri 31 October 2025 |
69.76 (-5.61%) |
73.09 |
66.05 - 75.12 |
0.9347 times |
Tue 30 September 2025 |
73.91 (1.85%) |
72.01 |
69.59 - 79.99 |
1.4876 times |
Fri 29 August 2025 |
72.57 (-4.27%) |
75.26 |
69.18 - 75.50 |
0.9242 times |
Thu 31 July 2025 |
75.81 (15.27%) |
65.78 |
64.66 - 77.83 |
1.28 times |
Mon 30 June 2025 |
65.77 (0.74%) |
65.05 |
61.26 - 66.87 |
1.6868 times |
Fri 30 May 2025 |
65.29 (10.64%) |
59.50 |
57.41 - 66.75 |
1.174 times |
Wed 30 April 2025 |
59.01 (-1.04%) |
59.04 |
49.26 - 60.46 |
1.0247 times |
Mon 31 March 2025 |
59.63 (-9.65%) |
65.82 |
57.68 - 66.53 |
0.5784 times |
Fri 28 February 2025 |
66.00 (-4.1%) |
67.33 |
62.30 - 68.76 |
0.4785 times |
DMA SMA EMA moving averages of Oppenheimer Holdings OPY
DMA (daily moving average) of Oppenheimer Holdings OPY
| DMA period | DMA value | | 5 day DMA | 67.91 | | 12 day DMA | 67 | | 20 day DMA | 67.32 | | 35 day DMA | 67.88 | | 50 day DMA | 69.5 | | 100 day DMA | 71.1 | | 150 day DMA | 68.62 | | 200 day DMA | 66.35 | EMA (exponential moving average) of Oppenheimer Holdings OPY
| EMA period | EMA current | EMA prev | EMA prev2 | | 5 day EMA | 68 | 67.75 | 67.26 | | 12 day EMA | 67.59 | 67.43 | 67.19 | | 20 day EMA | 67.76 | 67.68 | 67.57 | | 35 day EMA | 68.83 | 68.85 | 68.86 | | 50 day EMA | 70.08 | 70.15 | 70.21 |
SMA (simple moving average) of Oppenheimer Holdings OPY
| SMA period | SMA current | SMA prev | SMA prev2 | | 5 day SMA | 67.91 | 67.8 | 67.58 | | 12 day SMA | 67 | 66.66 | 66.53 | | 20 day SMA | 67.32 | 67.31 | 67.19 | | 35 day SMA | 67.88 | 67.91 | 67.93 | | 50 day SMA | 69.5 | 69.7 | 69.92 | | 100 day SMA | 71.1 | 71.08 | 71.06 | | 150 day SMA | 68.62 | 68.55 | 68.49 | | 200 day SMA | 66.35 | 66.33 | 66.3 |
|
|
