OldPoint OPOF full analysis,charts,indicators,moving averages,SMA,DMA,EMA,ADX,MACD,RSIOld Point OPOF WideScreen charts, DMA,SMA,EMA technical analysis, forecast prediction, by indicators ADX,MACD,RSI,CCI USA stock exchange
operates under Finance sector & deals in Major Banks
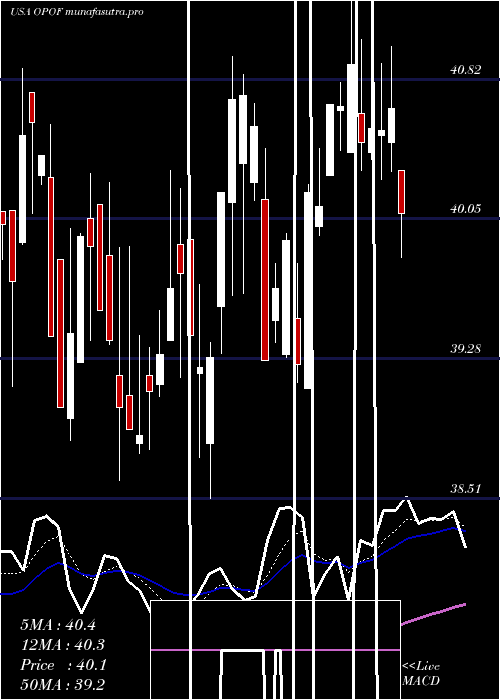
Daily price and charts and targets OldPoint Strong Daily Stock price targets for OldPoint OPOF are 39.57 and 39.92 | Daily Target 1 | 39.46 | | Daily Target 2 | 39.67 | | Daily Target 3 | 39.813333333333 | | Daily Target 4 | 40.02 | | Daily Target 5 | 40.16 |
Daily price and volume Old Point
| Date |
Closing |
Open |
Range |
Volume |
Fri 01 August 2025 |
39.87 (-0.7%) |
39.88 |
39.61 - 39.96 |
1.1149 times |
Thu 31 July 2025 |
40.15 (-0.35%) |
40.51 |
40.10 - 40.51 |
0.5489 times |
Wed 30 July 2025 |
40.29 (-0.17%) |
40.60 |
40.12 - 40.62 |
1.0978 times |
Tue 29 July 2025 |
40.36 (-0.35%) |
40.65 |
40.32 - 40.69 |
1.2779 times |
Mon 28 July 2025 |
40.50 (-0.2%) |
40.75 |
40.40 - 40.80 |
0.6003 times |
Fri 25 July 2025 |
40.58 (-1.72%) |
41.50 |
40.35 - 41.50 |
1.0806 times |
Thu 24 July 2025 |
41.29 (-0.17%) |
41.41 |
41.15 - 41.61 |
1.1235 times |
Wed 23 July 2025 |
41.36 (1.22%) |
41.16 |
40.75 - 41.36 |
0.3173 times |
Tue 22 July 2025 |
40.86 (-1.16%) |
41.20 |
40.56 - 41.56 |
1.7753 times |
Mon 21 July 2025 |
41.34 (0.58%) |
41.25 |
41.06 - 41.34 |
1.0635 times |
Fri 18 July 2025 |
41.10 (0.29%) |
41.05 |
40.75 - 41.17 |
1.2901 times |
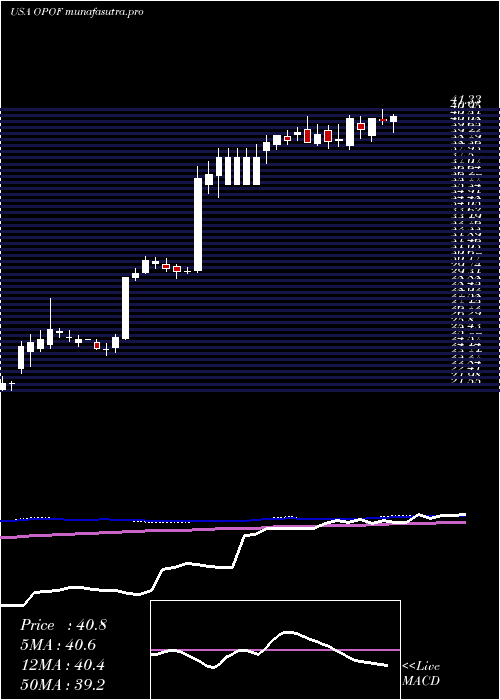
Weekly price and charts OldPoint Strong weekly Stock price targets for OldPoint OPOF are 39.15 and 40.34 | Weekly Target 1 | 38.9 | | Weekly Target 2 | 39.39 | | Weekly Target 3 | 40.093333333333 | | Weekly Target 4 | 40.58 | | Weekly Target 5 | 41.28 |
Weekly price and volumes for Old Point
| Date |
Closing |
Open |
Range |
Volume |
Fri 01 August 2025 |
39.87 (-1.75%) |
40.75 |
39.61 - 40.80 |
0.367 times |
Fri 25 July 2025 |
40.58 (-1.27%) |
41.25 |
40.35 - 41.61 |
0.424 times |
Fri 18 July 2025 |
41.10 (1.38%) |
40.47 |
39.75 - 41.17 |
0.5692 times |
Fri 11 July 2025 |
40.54 (-0.34%) |
40.65 |
40.27 - 41.33 |
0.4647 times |
Thu 03 July 2025 |
40.68 (1.88%) |
39.50 |
39.12 - 40.68 |
1.2612 times |
Fri 27 June 2025 |
39.93 (-1.92%) |
40.36 |
39.27 - 40.85 |
4.7958 times |
Fri 20 June 2025 |
40.71 (3.77%) |
38.81 |
38.51 - 40.95 |
1.0468 times |
Fri 13 June 2025 |
39.23 (0.33%) |
39.14 |
38.74 - 40.32 |
0.4328 times |
Fri 06 June 2025 |
39.10 (-1.14%) |
39.85 |
38.61 - 40.25 |
0.4254 times |
Fri 30 May 2025 |
39.55 (1.38%) |
38.95 |
38.83 - 40.30 |
0.213 times |
Fri 23 May 2025 |
39.01 (-1.76%) |
39.92 |
39.01 - 40.88 |
0.3012 times |
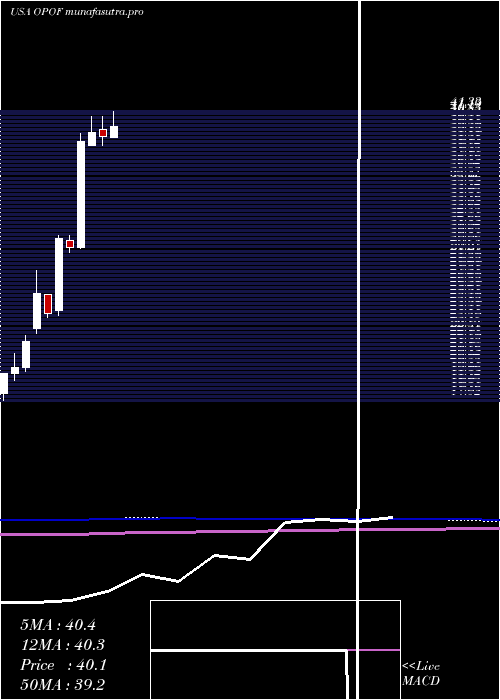
Monthly price and charts OldPoint Strong monthly Stock price targets for OldPoint OPOF are 39.57 and 39.92 | Monthly Target 1 | 39.46 | | Monthly Target 2 | 39.67 | | Monthly Target 3 | 39.813333333333 | | Monthly Target 4 | 40.02 | | Monthly Target 5 | 40.16 |
Monthly price and volumes Old Point
| Date |
Closing |
Open |
Range |
Volume |
Fri 01 August 2025 |
39.87 (-0.7%) |
39.88 |
39.61 - 39.96 |
0.0394 times |
Thu 31 July 2025 |
40.15 (2.29%) |
39.12 |
39.12 - 41.61 |
1.192 times |
Mon 30 June 2025 |
39.25 (-0.76%) |
39.85 |
38.51 - 40.95 |
3.1419 times |
Fri 30 May 2025 |
39.55 (1.83%) |
38.51 |
38.51 - 40.88 |
0.5672 times |
Wed 30 April 2025 |
38.84 (29.73%) |
29.90 |
29.85 - 39.49 |
2.3081 times |
Mon 31 March 2025 |
29.94 (-2.44%) |
30.50 |
29.45 - 30.93 |
0.6241 times |
Fri 28 February 2025 |
30.69 (25.78%) |
24.59 |
24.24 - 30.95 |
0.402 times |
Fri 31 January 2025 |
24.40 (-6.37%) |
26.00 |
24.01 - 26.00 |
0.2276 times |
Tue 31 December 2024 |
26.06 (18.24%) |
23.07 |
22.70 - 28.00 |
0.2352 times |
Tue 26 November 2024 |
22.04 (11.2%) |
19.84 |
19.48 - 22.51 |
1.2626 times |
Thu 31 October 2024 |
19.82 (2.59%) |
19.35 |
18.75 - 21.00 |
0.1652 times |
DMA SMA EMA moving averages of Old Point OPOF
DMA (daily moving average) of Old Point OPOF
| DMA period | DMA value | | 5 day DMA | 40.23 | | 12 day DMA | 40.72 | | 20 day DMA | 40.67 | | 35 day DMA | 40.35 | | 50 day DMA | 40.1 | | 100 day DMA | 38 | | 150 day DMA | 34.22 | | 200 day DMA | 30.94 | EMA (exponential moving average) of Old Point OPOF
| EMA period | EMA current | EMA prev | EMA prev2 | | 5 day EMA | 40.23 | 40.41 | 40.54 | | 12 day EMA | 40.47 | 40.58 | 40.66 | | 20 day EMA | 40.49 | 40.55 | 40.59 | | 35 day EMA | 40.35 | 40.38 | 40.39 | | 50 day EMA | 40.09 | 40.1 | 40.1 |
SMA (simple moving average) of Old Point OPOF
| SMA period | SMA current | SMA prev | SMA prev2 | | 5 day SMA | 40.23 | 40.38 | 40.6 | | 12 day SMA | 40.72 | 40.8 | 40.8 | | 20 day SMA | 40.67 | 40.71 | 40.71 | | 35 day SMA | 40.35 | 40.35 | 40.32 | | 50 day SMA | 40.1 | 40.11 | 40.1 | | 100 day SMA | 38 | 37.9 | 37.81 | | 150 day SMA | 34.22 | 34.12 | 34.02 | | 200 day SMA | 30.94 | 30.84 | 30.73 |
|
|
