OfficeProperties OPI full analysis,charts,indicators,moving averages,SMA,DMA,EMA,ADX,MACD,RSIOffice Properties OPI WideScreen charts, DMA,SMA,EMA technical analysis, forecast prediction, by indicators ADX,MACD,RSI,CCI USA stock exchange
operates under Finance sector & deals in Real Estate
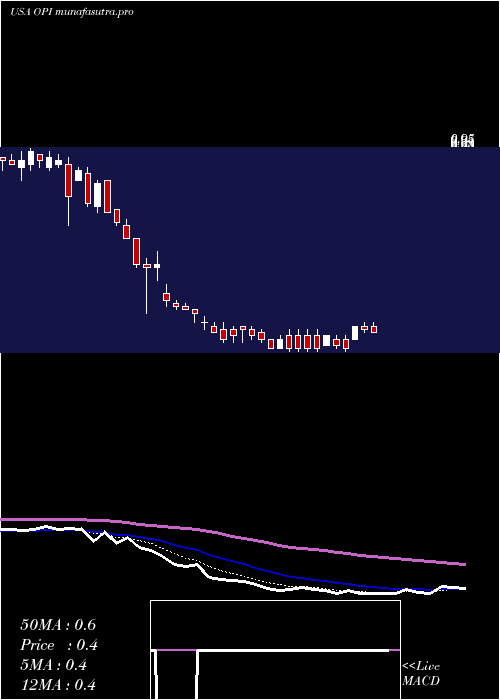
Daily price and charts and targets OfficeProperties Strong Daily Stock price targets for OfficeProperties OPI are 0.18 and 0.21 | Daily Target 1 | 0.17 | | Daily Target 2 | 0.18 | | Daily Target 3 | 0.2 | | Daily Target 4 | 0.21 | | Daily Target 5 | 0.23 |
Daily price and volume Office Properties
| Date |
Closing |
Open |
Range |
Volume |
Wed 03 September 2025 |
0.19 (-9.52%) |
0.22 |
0.19 - 0.22 |
1.0788 times |
Tue 02 September 2025 |
0.21 (0%) |
0.22 |
0.21 - 0.22 |
0.5327 times |
Fri 29 August 2025 |
0.21 (0%) |
0.23 |
0.21 - 0.23 |
0.7005 times |
Fri 29 August 2025 |
0.21 (-4.55%) |
0.23 |
0.21 - 0.23 |
0.7015 times |
Thu 28 August 2025 |
0.22 (0%) |
0.22 |
0.21 - 0.22 |
0.9277 times |
Wed 27 August 2025 |
0.22 (4.76%) |
0.21 |
0.21 - 0.22 |
0.8887 times |
Tue 26 August 2025 |
0.21 (-4.55%) |
0.23 |
0.21 - 0.23 |
1.9561 times |
Mon 25 August 2025 |
0.22 (0%) |
0.23 |
0.21 - 0.24 |
1.4233 times |
Fri 22 August 2025 |
0.22 (0%) |
0.22 |
0.22 - 0.24 |
1.4752 times |
Thu 21 August 2025 |
0.22 (0%) |
0.23 |
0.22 - 0.23 |
0.3156 times |
Wed 20 August 2025 |
0.22 (0%) |
0.22 |
0.22 - 0.22 |
0.5222 times |
Weekly price and charts OfficeProperties Strong weekly Stock price targets for OfficeProperties OPI are 0.18 and 0.21 | Weekly Target 1 | 0.17 | | Weekly Target 2 | 0.18 | | Weekly Target 3 | 0.2 | | Weekly Target 4 | 0.21 | | Weekly Target 5 | 0.23 |
Weekly price and volumes for Office Properties
| Date |
Closing |
Open |
Range |
Volume |
Wed 03 September 2025 |
0.19 (-9.52%) |
0.22 |
0.19 - 0.22 |
0.3538 times |
Fri 29 August 2025 |
0.21 (0%) |
0.23 |
0.21 - 0.23 |
0.1538 times |
Fri 29 August 2025 |
0.21 (-4.55%) |
0.23 |
0.21 - 0.24 |
1.2946 times |
Fri 22 August 2025 |
0.22 (-8.33%) |
0.24 |
0.22 - 0.24 |
0.8361 times |
Fri 15 August 2025 |
0.24 (4.35%) |
0.24 |
0.23 - 0.25 |
0.5687 times |
Fri 08 August 2025 |
0.23 (0%) |
0.23 |
0.23 - 0.25 |
0.4166 times |
Fri 01 August 2025 |
0.23 (-17.86%) |
0.28 |
0.22 - 0.29 |
1.6659 times |
Fri 25 July 2025 |
0.28 (16.67%) |
0.24 |
0.24 - 0.33 |
2.3943 times |
Fri 18 July 2025 |
0.24 (-14.29%) |
0.28 |
0.23 - 0.29 |
0.8123 times |
Fri 11 July 2025 |
0.28 (0%) |
0.28 |
0.26 - 0.34 |
1.504 times |
Thu 03 July 2025 |
0.28 (33.33%) |
0.22 |
0.22 - 0.29 |
0.7886 times |
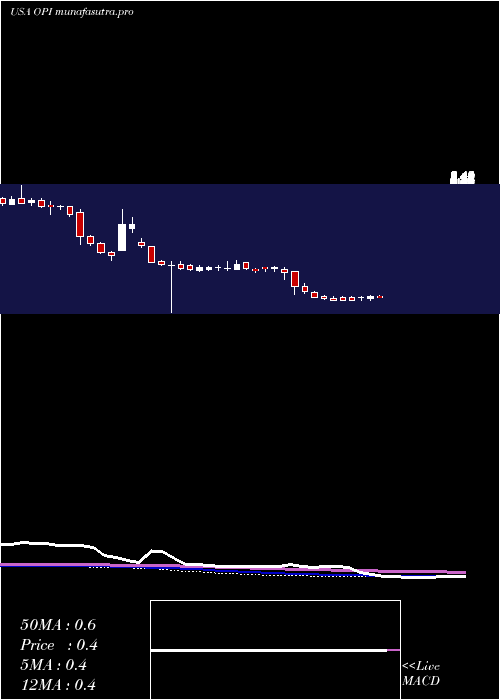
Monthly price and charts OfficeProperties Strong monthly Stock price targets for OfficeProperties OPI are 0.18 and 0.21 | Monthly Target 1 | 0.17 | | Monthly Target 2 | 0.18 | | Monthly Target 3 | 0.2 | | Monthly Target 4 | 0.21 | | Monthly Target 5 | 0.23 |
Monthly price and volumes Office Properties
| Date |
Closing |
Open |
Range |
Volume |
Wed 03 September 2025 |
0.19 (-9.52%) |
0.22 |
0.19 - 0.22 |
0.0773 times |
Fri 29 August 2025 |
0.21 (-12.5%) |
0.24 |
0.21 - 0.25 |
0.7837 times |
Thu 31 July 2025 |
0.24 (-4%) |
0.25 |
0.23 - 0.34 |
1.4468 times |
Mon 30 June 2025 |
0.25 (31.58%) |
0.21 |
0.18 - 0.30 |
1.5792 times |
Fri 30 May 2025 |
0.19 (-53.66%) |
0.39 |
0.18 - 0.39 |
1.6467 times |
Wed 30 April 2025 |
0.41 (-10.87%) |
0.46 |
0.32 - 0.47 |
0.8575 times |
Mon 31 March 2025 |
0.46 (-49.45%) |
0.91 |
0.44 - 0.95 |
1.3352 times |
Fri 28 February 2025 |
0.91 (0%) |
0.90 |
0.84 - 1.05 |
0.523 times |
Fri 31 January 2025 |
0.91 (810%) |
0.10 |
0.10 - 1.04 |
0.7972 times |
Tue 31 December 2024 |
0.10 (-94.19%) |
1.38 |
0.10 - 1.46 |
0.9534 times |
Tue 26 November 2024 |
1.72 (8.18%) |
1.56 |
1.06 - 1.99 |
2.3973 times |

DMA SMA EMA moving averages of Office Properties OPI
DMA (daily moving average) of Office Properties OPI
| DMA period | DMA value | | 5 day DMA | 0.21 | | 12 day DMA | 0.21 | | 20 day DMA | 0.22 | | 35 day DMA | 0.24 | | 50 day DMA | 0.25 | | 100 day DMA | 0.26 | | 150 day DMA | 0.43 | | 200 day DMA | 0.6 | EMA (exponential moving average) of Office Properties OPI
| EMA period | EMA current | EMA prev | EMA prev2 | | 5 day EMA | 0.21 | 0.22 | 0.22 | | 12 day EMA | 0.23 | 0.24 | 0.24 | | 20 day EMA | 0.25 | 0.26 | 0.26 | | 35 day EMA | 0.26 | 0.26 | 0.26 | | 50 day EMA | 0.25 | 0.25 | 0.25 |
SMA (simple moving average) of Office Properties OPI
| SMA period | SMA current | SMA prev | SMA prev2 | | 5 day SMA | 0.21 | 0.21 | 0.21 | | 12 day SMA | 0.21 | 0.22 | 0.22 | | 20 day SMA | 0.22 | 0.23 | 0.23 | | 35 day SMA | 0.24 | 0.24 | 0.24 | | 50 day SMA | 0.25 | 0.25 | 0.25 | | 100 day SMA | 0.26 | 0.26 | 0.26 | | 150 day SMA | 0.43 | 0.44 | 0.44 | | 200 day SMA | 0.6 | 0.61 | 0.62 |
|
|
