OncolyticsBiotech ONCY full analysis,charts,indicators,moving averages,SMA,DMA,EMA,ADX,MACD,RSIOncolytics Biotech ONCY WideScreen charts, DMA,SMA,EMA technical analysis, forecast prediction, by indicators ADX,MACD,RSI,CCI USA stock exchange
operates under Health Care sector & deals in Major Pharmaceuticals
Daily price and charts and targets OncolyticsBiotech Strong Daily Stock price targets for OncolyticsBiotech ONCY are 1.09 and 1.13 | Daily Target 1 | 1.08 | | Daily Target 2 | 1.09 | | Daily Target 3 | 1.1166666666667 | | Daily Target 4 | 1.13 | | Daily Target 5 | 1.16 |
Daily price and volume Oncolytics Biotech
| Date |
Closing |
Open |
Range |
Volume |
Tue 21 October 2025 |
1.11 (-1.77%) |
1.14 |
1.10 - 1.14 |
0.6216 times |
Mon 20 October 2025 |
1.13 (-2.59%) |
1.19 |
1.10 - 1.19 |
1.4378 times |
Fri 17 October 2025 |
1.16 (-0.85%) |
1.18 |
1.13 - 1.21 |
0.5296 times |
Thu 16 October 2025 |
1.17 (-3.31%) |
1.22 |
1.16 - 1.23 |
0.8125 times |
Wed 15 October 2025 |
1.21 (0%) |
1.20 |
1.19 - 1.26 |
0.8039 times |
Tue 14 October 2025 |
1.21 (3.42%) |
1.19 |
1.15 - 1.23 |
0.7075 times |
Mon 13 October 2025 |
1.17 (-2.5%) |
1.16 |
1.14 - 1.22 |
1.1081 times |
Fri 10 October 2025 |
1.20 (-3.23%) |
1.27 |
1.19 - 1.30 |
1.1699 times |
Thu 09 October 2025 |
1.24 (-3.13%) |
1.28 |
1.23 - 1.30 |
1.0182 times |
Wed 08 October 2025 |
1.28 (-5.19%) |
1.34 |
1.27 - 1.36 |
1.7909 times |
Tue 07 October 2025 |
1.35 (-0.74%) |
1.35 |
1.33 - 1.39 |
0.8981 times |
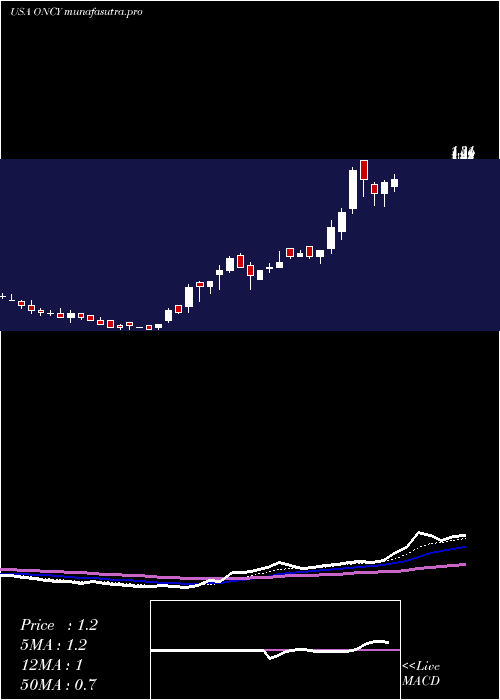
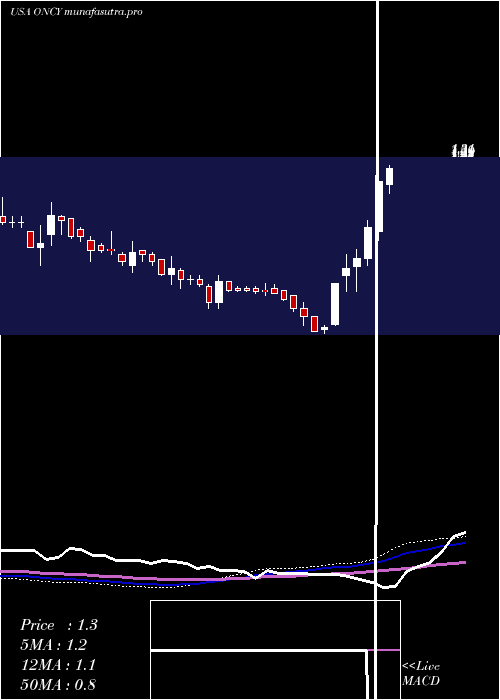
Weekly price and charts OncolyticsBiotech Strong weekly Stock price targets for OncolyticsBiotech ONCY are 1.06 and 1.15 | Weekly Target 1 | 1.04 | | Weekly Target 2 | 1.08 | | Weekly Target 3 | 1.1333333333333 | | Weekly Target 4 | 1.17 | | Weekly Target 5 | 1.22 |
Weekly price and volumes for Oncolytics Biotech
| Date |
Closing |
Open |
Range |
Volume |
Tue 21 October 2025 |
1.11 (-4.31%) |
1.19 |
1.10 - 1.19 |
0.3921 times |
Fri 17 October 2025 |
1.16 (-3.33%) |
1.16 |
1.13 - 1.26 |
0.7542 times |
Fri 10 October 2025 |
1.20 (-16.08%) |
1.42 |
1.19 - 1.43 |
1.0423 times |
Fri 03 October 2025 |
1.43 (10.85%) |
1.33 |
1.33 - 1.51 |
1.5318 times |
Fri 26 September 2025 |
1.29 (-5.15%) |
1.34 |
1.20 - 1.35 |
0.5855 times |
Fri 19 September 2025 |
1.36 (6.25%) |
1.32 |
1.20 - 1.40 |
1.2194 times |
Fri 12 September 2025 |
1.28 (20.75%) |
1.14 |
1.14 - 1.44 |
2.8267 times |
Fri 05 September 2025 |
1.06 (1.92%) |
1.04 |
1.02 - 1.25 |
0.8196 times |
Fri 29 August 2025 |
1.04 (0%) |
1.09 |
1.01 - 1.13 |
0.1287 times |
Fri 29 August 2025 |
1.04 (2.97%) |
1.01 |
0.95 - 1.15 |
0.6996 times |
Fri 22 August 2025 |
1.01 (-6.48%) |
1.06 |
0.96 - 1.09 |
0.522 times |
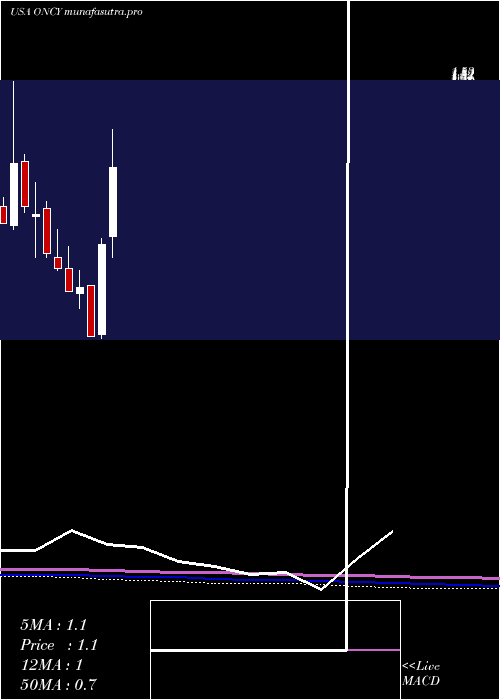
Monthly price and charts OncolyticsBiotech Strong monthly Stock price targets for OncolyticsBiotech ONCY are 0.92 and 1.29 | Monthly Target 1 | 0.86 | | Monthly Target 2 | 0.98 | | Monthly Target 3 | 1.2266666666667 | | Monthly Target 4 | 1.35 | | Monthly Target 5 | 1.6 |
Monthly price and volumes Oncolytics Biotech
| Date |
Closing |
Open |
Range |
Volume |
Tue 21 October 2025 |
1.11 (-20.71%) |
1.40 |
1.10 - 1.47 |
0.6228 times |
Tue 30 September 2025 |
1.40 (34.62%) |
1.04 |
1.02 - 1.51 |
1.5235 times |
Fri 29 August 2025 |
1.04 (1.96%) |
1.00 |
0.82 - 1.15 |
0.6795 times |
Thu 31 July 2025 |
1.02 (32.47%) |
0.81 |
0.71 - 1.35 |
1.5695 times |
Mon 30 June 2025 |
0.77 (126.47%) |
0.35 |
0.33 - 0.80 |
1.1332 times |
Fri 30 May 2025 |
0.34 (-40.35%) |
0.58 |
0.34 - 0.58 |
0.8209 times |
Wed 30 April 2025 |
0.57 (3.64%) |
0.54 |
0.47 - 0.65 |
0.3624 times |
Mon 31 March 2025 |
0.55 (-16.67%) |
0.66 |
0.55 - 0.76 |
0.232 times |
Fri 28 February 2025 |
0.66 (-9.59%) |
0.71 |
0.65 - 0.84 |
0.4116 times |
Fri 31 January 2025 |
0.73 (-19.78%) |
0.94 |
0.71 - 0.97 |
2.6445 times |
Tue 31 December 2024 |
0.91 (-4.21%) |
0.90 |
0.71 - 1.06 |
0.5568 times |
DMA SMA EMA moving averages of Oncolytics Biotech ONCY
DMA (daily moving average) of Oncolytics Biotech ONCY
| DMA period | DMA value | | 5 day DMA | 1.16 | | 12 day DMA | 1.22 | | 20 day DMA | 1.27 | | 35 day DMA | 1.27 | | 50 day DMA | 1.2 | | 100 day DMA | 1.02 | | 150 day DMA | 0.86 | | 200 day DMA | 0.83 | EMA (exponential moving average) of Oncolytics Biotech ONCY
| EMA period | EMA current | EMA prev | EMA prev2 | | 5 day EMA | 1.15 | 1.17 | 1.19 | | 12 day EMA | 1.2 | 1.22 | 1.24 | | 20 day EMA | 1.22 | 1.23 | 1.24 | | 35 day EMA | 1.2 | 1.21 | 1.22 | | 50 day EMA | 1.17 | 1.17 | 1.17 |
SMA (simple moving average) of Oncolytics Biotech ONCY
| SMA period | SMA current | SMA prev | SMA prev2 | | 5 day SMA | 1.16 | 1.18 | 1.18 | | 12 day SMA | 1.22 | 1.24 | 1.27 | | 20 day SMA | 1.27 | 1.28 | 1.29 | | 35 day SMA | 1.27 | 1.27 | 1.27 | | 50 day SMA | 1.2 | 1.19 | 1.19 | | 100 day SMA | 1.02 | 1.01 | 1.01 | | 150 day SMA | 0.86 | 0.86 | 0.85 | | 200 day SMA | 0.83 | 0.83 | 0.83 |
|
|
