OnSemiconductor ON full analysis,charts,indicators,moving averages,SMA,DMA,EMA,ADX,MACD,RSIOn Semiconductor ON WideScreen charts, DMA,SMA,EMA technical analysis, forecast prediction, by indicators ADX,MACD,RSI,CCI USA stock exchange
operates under Technology sector & deals in Semiconductors
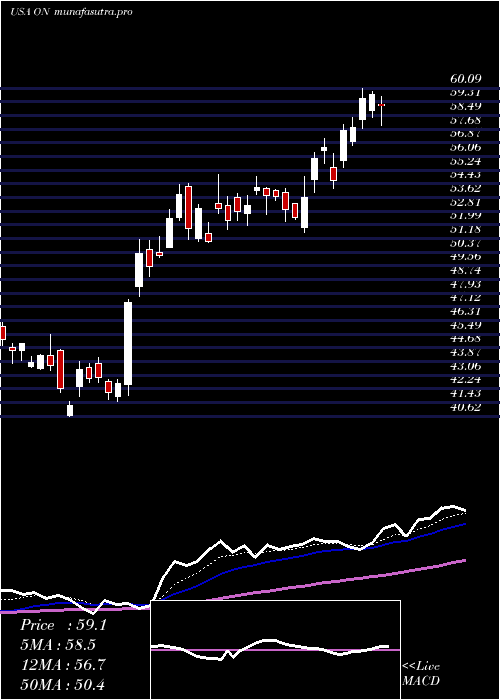
Daily price and charts and targets OnSemiconductor Strong Daily Stock price targets for OnSemiconductor ON are 53.19 and 55.95 | Daily Target 1 | 52.65 | | Daily Target 2 | 53.72 | | Daily Target 3 | 55.41 | | Daily Target 4 | 56.48 | | Daily Target 5 | 58.17 |
Daily price and volume On Semiconductor
| Date |
Closing |
Open |
Range |
Volume |
Thu 04 December 2025 |
54.79 (-4.13%) |
56.54 |
54.34 - 57.10 |
0.7362 times |
Wed 03 December 2025 |
57.15 (11.01%) |
51.58 |
51.49 - 57.52 |
1.6218 times |
Tue 02 December 2025 |
51.48 (2.08%) |
50.58 |
49.13 - 51.97 |
1.4284 times |
Mon 01 December 2025 |
50.43 (0.38%) |
49.49 |
49.26 - 51.33 |
0.7721 times |
Fri 28 November 2025 |
50.24 (1.21%) |
49.90 |
49.48 - 50.47 |
0.4348 times |
Wed 26 November 2025 |
49.64 (2.75%) |
48.39 |
48.20 - 50.33 |
0.5498 times |
Tue 25 November 2025 |
48.31 (1.94%) |
47.23 |
47.06 - 48.71 |
0.7641 times |
Mon 24 November 2025 |
47.39 (1.48%) |
47.17 |
46.68 - 47.98 |
0.7265 times |
Fri 21 November 2025 |
46.70 (4.01%) |
45.17 |
44.56 - 47.66 |
1.7244 times |
Thu 20 November 2025 |
44.90 (-2.65%) |
46.49 |
44.69 - 47.15 |
1.2419 times |
Wed 19 November 2025 |
46.12 (1.25%) |
47.16 |
45.96 - 47.73 |
1.4196 times |
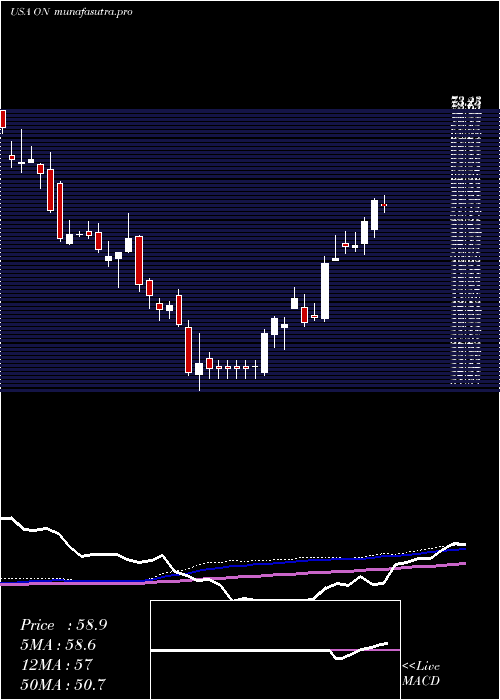
Weekly price and charts OnSemiconductor Strong weekly Stock price targets for OnSemiconductor ON are 51.96 and 60.35 | Weekly Target 1 | 45.42 | | Weekly Target 2 | 50.11 | | Weekly Target 3 | 53.813333333333 | | Weekly Target 4 | 58.5 | | Weekly Target 5 | 62.2 |
Weekly price and volumes for On Semiconductor
| Date |
Closing |
Open |
Range |
Volume |
Thu 04 December 2025 |
54.79 (9.06%) |
49.49 |
49.13 - 57.52 |
1.118 times |
Fri 28 November 2025 |
50.24 (7.58%) |
47.17 |
46.68 - 50.47 |
0.6071 times |
Fri 21 November 2025 |
46.70 (-0.47%) |
46.53 |
44.56 - 47.73 |
1.4174 times |
Fri 14 November 2025 |
46.92 (-1.9%) |
49.05 |
46.51 - 50.32 |
0.7404 times |
Fri 07 November 2025 |
47.83 (-4.49%) |
50.30 |
46.31 - 51.18 |
0.9392 times |
Fri 31 October 2025 |
50.08 (0%) |
51.00 |
49.95 - 51.75 |
0.3413 times |
Fri 31 October 2025 |
50.08 (-1.24%) |
51.84 |
49.95 - 54.68 |
1.3716 times |
Fri 24 October 2025 |
50.71 (-3.9%) |
53.01 |
49.09 - 55.99 |
1.0423 times |
Fri 17 October 2025 |
52.77 (15.37%) |
47.90 |
47.60 - 53.34 |
1.1796 times |
Fri 10 October 2025 |
45.74 (-7.75%) |
49.49 |
45.64 - 51.26 |
1.2432 times |
Fri 03 October 2025 |
49.58 (-1.16%) |
50.80 |
47.90 - 50.90 |
0.9769 times |
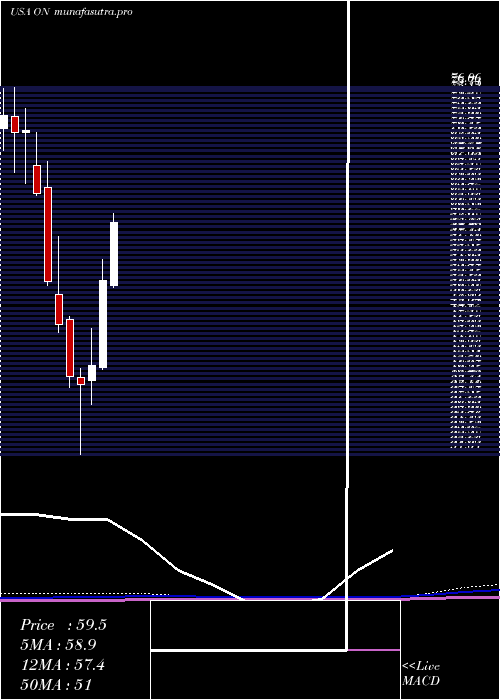
Monthly price and charts OnSemiconductor Strong monthly Stock price targets for OnSemiconductor ON are 51.96 and 60.35 | Monthly Target 1 | 45.42 | | Monthly Target 2 | 50.11 | | Monthly Target 3 | 53.813333333333 | | Monthly Target 4 | 58.5 | | Monthly Target 5 | 62.2 |
Monthly price and volumes On Semiconductor
| Date |
Closing |
Open |
Range |
Volume |
Thu 04 December 2025 |
54.79 (9.06%) |
49.49 |
49.13 - 57.52 |
0.2243 times |
Fri 28 November 2025 |
50.24 (0.32%) |
50.30 |
44.56 - 51.18 |
0.7433 times |
Fri 31 October 2025 |
50.08 (1.56%) |
49.35 |
45.64 - 55.99 |
1.1522 times |
Tue 30 September 2025 |
49.31 (-0.56%) |
48.15 |
46.50 - 52.81 |
0.9274 times |
Fri 29 August 2025 |
49.59 (-12.01%) |
55.68 |
46.35 - 57.41 |
1.0507 times |
Thu 31 July 2025 |
56.36 (7.54%) |
51.81 |
51.53 - 63.63 |
1.1264 times |
Mon 30 June 2025 |
52.41 (24.73%) |
41.82 |
41.49 - 55.01 |
1.207 times |
Fri 30 May 2025 |
42.02 (5.84%) |
40.22 |
37.19 - 46.59 |
1.2642 times |
Wed 30 April 2025 |
39.70 (-2.43%) |
40.51 |
31.04 - 41.59 |
1.3382 times |
Mon 31 March 2025 |
40.69 (-13.52%) |
47.59 |
39.36 - 48.01 |
0.9664 times |
Fri 28 February 2025 |
47.05 (-10.11%) |
50.65 |
46.04 - 57.77 |
1.1515 times |
DMA SMA EMA moving averages of On Semiconductor ON
DMA (daily moving average) of On Semiconductor ON
| DMA period | DMA value | | 5 day DMA | 52.82 | | 12 day DMA | 49.39 | | 20 day DMA | 48.83 | | 35 day DMA | 50.05 | | 50 day DMA | 49.85 | | 100 day DMA | 50.9 | | 150 day DMA | 50.22 | | 200 day DMA | 47.92 | EMA (exponential moving average) of On Semiconductor ON
| EMA period | EMA current | EMA prev | EMA prev2 | | 5 day EMA | 53.2 | 52.4 | 50.03 | | 12 day EMA | 50.91 | 50.2 | 48.94 | | 20 day EMA | 50.14 | 49.65 | 48.86 | | 35 day EMA | 49.84 | 49.55 | 49.1 | | 50 day EMA | 50.28 | 50.1 | 49.81 |
SMA (simple moving average) of On Semiconductor ON
| SMA period | SMA current | SMA prev | SMA prev2 | | 5 day SMA | 52.82 | 51.79 | 50.02 | | 12 day SMA | 49.39 | 48.66 | 47.81 | | 20 day SMA | 48.83 | 48.6 | 48.15 | | 35 day SMA | 50.05 | 49.93 | 49.71 | | 50 day SMA | 49.85 | 49.78 | 49.64 | | 100 day SMA | 50.9 | 50.95 | 50.96 | | 150 day SMA | 50.22 | 50.12 | 50 | | 200 day SMA | 47.92 | 47.93 | 47.9 |
|
|
