OwensMinor OMI full analysis,charts,indicators,moving averages,SMA,DMA,EMA,ADX,MACD,RSIOwens Minor OMI WideScreen charts, DMA,SMA,EMA technical analysis, forecast prediction, by indicators ADX,MACD,RSI,CCI USA stock exchange
operates under Health Care sector & deals in Medical Specialities
Daily price and charts and targets OwensMinor Strong Daily Stock price targets for OwensMinor OMI are 2.43 and 2.58 | Daily Target 1 | 2.38 | | Daily Target 2 | 2.47 | | Daily Target 3 | 2.5333333333333 | | Daily Target 4 | 2.62 | | Daily Target 5 | 2.68 |
Daily price and volume Owens Minor
| Date |
Closing |
Open |
Range |
Volume |
Thu 04 December 2025 |
2.55 (-1.92%) |
2.60 |
2.45 - 2.60 |
1.3431 times |
Wed 03 December 2025 |
2.60 (-2.99%) |
2.67 |
2.60 - 2.75 |
0.8992 times |
Tue 02 December 2025 |
2.68 (0.37%) |
2.68 |
2.66 - 2.84 |
0.8558 times |
Mon 01 December 2025 |
2.67 (-1.84%) |
2.69 |
2.62 - 2.77 |
1.1322 times |
Fri 28 November 2025 |
2.72 (-1.09%) |
2.76 |
2.68 - 2.79 |
0.4082 times |
Wed 26 November 2025 |
2.75 (0%) |
2.75 |
2.72 - 2.80 |
0.6248 times |
Tue 25 November 2025 |
2.75 (0.73%) |
2.72 |
2.65 - 2.88 |
1.1729 times |
Mon 24 November 2025 |
2.73 (1.49%) |
2.71 |
2.63 - 2.73 |
1.9253 times |
Fri 21 November 2025 |
2.69 (3.46%) |
2.60 |
2.58 - 2.74 |
1.0493 times |
Thu 20 November 2025 |
2.60 (-4.76%) |
2.80 |
2.58 - 2.86 |
0.5893 times |
Wed 19 November 2025 |
2.73 (-5.54%) |
2.88 |
2.73 - 2.92 |
0.7212 times |
Weekly price and charts OwensMinor Strong weekly Stock price targets for OwensMinor OMI are 2.31 and 2.7 | Weekly Target 1 | 2.22 | | Weekly Target 2 | 2.39 | | Weekly Target 3 | 2.6133333333333 | | Weekly Target 4 | 2.78 | | Weekly Target 5 | 3 |
Weekly price and volumes for Owens Minor
| Date |
Closing |
Open |
Range |
Volume |
Thu 04 December 2025 |
2.55 (-6.25%) |
2.69 |
2.45 - 2.84 |
0.9355 times |
Fri 28 November 2025 |
2.72 (1.12%) |
2.71 |
2.63 - 2.88 |
0.9136 times |
Fri 21 November 2025 |
2.69 (-3.93%) |
2.78 |
2.58 - 2.99 |
1.0118 times |
Fri 14 November 2025 |
2.80 (-11.95%) |
3.25 |
2.79 - 3.30 |
1.2931 times |
Fri 07 November 2025 |
3.18 (-19.9%) |
3.36 |
3.05 - 3.59 |
1.1003 times |
Fri 31 October 2025 |
3.97 (0%) |
4.98 |
3.76 - 5.12 |
0.8558 times |
Fri 31 October 2025 |
3.97 (-27.95%) |
5.54 |
3.76 - 5.60 |
1.4132 times |
Fri 24 October 2025 |
5.51 (14.79%) |
4.87 |
4.73 - 5.53 |
0.8422 times |
Fri 17 October 2025 |
4.80 (0.84%) |
4.56 |
4.35 - 4.99 |
0.9624 times |
Tue 07 October 2025 |
4.76 (-2.06%) |
4.82 |
4.60 - 4.90 |
0.6721 times |
Fri 03 October 2025 |
4.86 (1.89%) |
4.79 |
4.60 - 5.09 |
0.8095 times |

Monthly price and charts OwensMinor Strong monthly Stock price targets for OwensMinor OMI are 2.31 and 2.7 | Monthly Target 1 | 2.22 | | Monthly Target 2 | 2.39 | | Monthly Target 3 | 2.6133333333333 | | Monthly Target 4 | 2.78 | | Monthly Target 5 | 3 |
Monthly price and volumes Owens Minor
| Date |
Closing |
Open |
Range |
Volume |
Thu 04 December 2025 |
2.55 (-6.25%) |
2.69 |
2.45 - 2.84 |
0.2304 times |
Fri 28 November 2025 |
2.72 (-31.49%) |
3.36 |
2.58 - 3.59 |
1.0635 times |
Fri 31 October 2025 |
3.97 (-17.29%) |
4.80 |
3.76 - 5.60 |
1.2751 times |
Tue 30 September 2025 |
4.80 (-2.04%) |
4.81 |
4.60 - 5.69 |
1.8502 times |
Fri 29 August 2025 |
4.90 (-29.29%) |
6.77 |
4.56 - 7.10 |
1.3297 times |
Thu 31 July 2025 |
6.93 (-23.85%) |
8.93 |
6.84 - 9.55 |
0.6185 times |
Mon 30 June 2025 |
9.10 (37.88%) |
6.44 |
6.17 - 9.14 |
0.92 times |
Fri 30 May 2025 |
6.60 (-6.52%) |
7.15 |
6.35 - 8.60 |
0.8119 times |
Wed 30 April 2025 |
7.06 (-21.82%) |
9.14 |
6.23 - 9.80 |
0.9494 times |
Mon 31 March 2025 |
9.03 (-5.74%) |
9.40 |
8.37 - 10.43 |
0.9513 times |
Fri 28 February 2025 |
9.58 (-32.72%) |
12.80 |
6.07 - 13.00 |
1.6285 times |

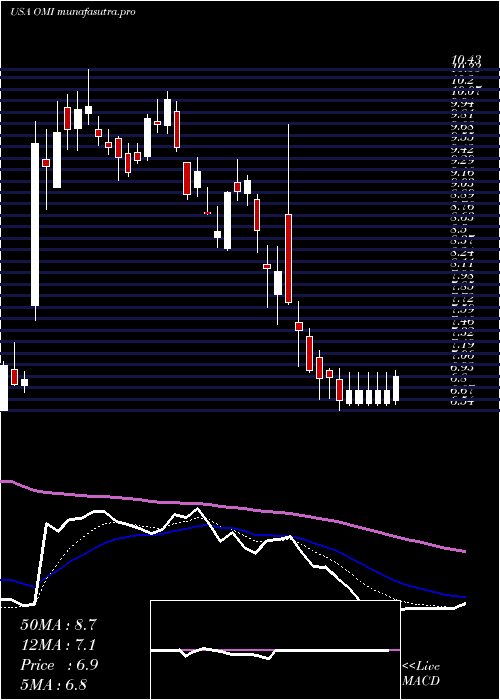
DMA SMA EMA moving averages of Owens Minor OMI
DMA (daily moving average) of Owens Minor OMI
| DMA period | DMA value | | 5 day DMA | 2.64 | | 12 day DMA | 2.7 | | 20 day DMA | 2.8 | | 35 day DMA | 3.63 | | 50 day DMA | 4 | | 100 day DMA | 5.08 | | 150 day DMA | 5.91 | | 200 day DMA | 6.45 | EMA (exponential moving average) of Owens Minor OMI
| EMA period | EMA current | EMA prev | EMA prev2 | | 5 day EMA | 2.63 | 2.67 | 2.7 | | 12 day EMA | 2.75 | 2.79 | 2.82 | | 20 day EMA | 2.98 | 3.03 | 3.08 | | 35 day EMA | 3.43 | 3.48 | 3.53 | | 50 day EMA | 3.96 | 4.02 | 4.08 |
SMA (simple moving average) of Owens Minor OMI
| SMA period | SMA current | SMA prev | SMA prev2 | | 5 day SMA | 2.64 | 2.68 | 2.71 | | 12 day SMA | 2.7 | 2.73 | 2.74 | | 20 day SMA | 2.8 | 2.84 | 2.89 | | 35 day SMA | 3.63 | 3.69 | 3.74 | | 50 day SMA | 4 | 4.05 | 4.11 | | 100 day SMA | 5.08 | 5.13 | 5.19 | | 150 day SMA | 5.91 | 5.94 | 5.97 | | 200 day SMA | 6.45 | 6.48 | 6.5 |
|
|
