OmerosCorporation OMER full analysis,charts,indicators,moving averages,SMA,DMA,EMA,ADX,MACD,RSIOmeros Corporation OMER WideScreen charts, DMA,SMA,EMA technical analysis, forecast prediction, by indicators ADX,MACD,RSI,CCI USA stock exchange
operates under Health Care sector & deals in Major Pharmaceuticals
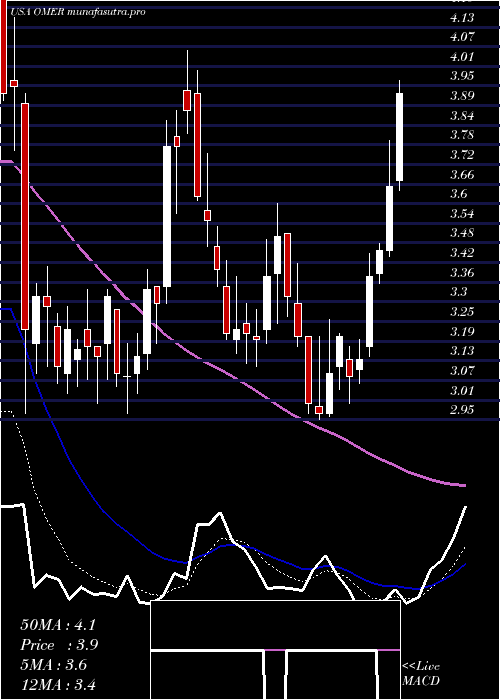
Daily price and charts and targets OmerosCorporation Strong Daily Stock price targets for OmerosCorporation OMER are 10.69 and 11.38 | Daily Target 1 | 10.11 | | Daily Target 2 | 10.57 | | Daily Target 3 | 10.8 | | Daily Target 4 | 11.26 | | Daily Target 5 | 11.49 |
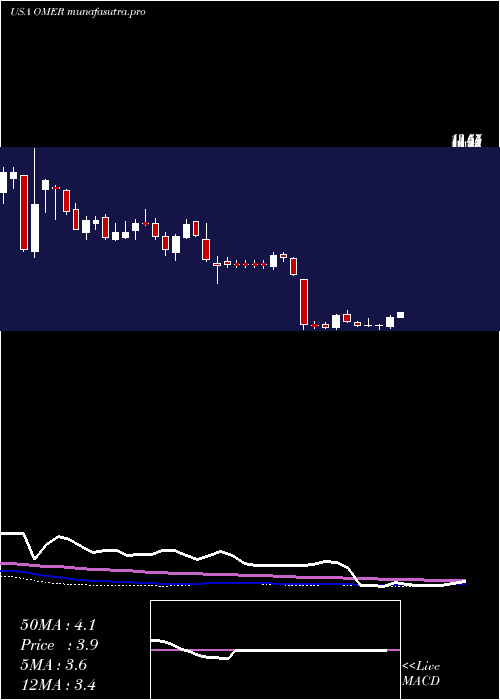
Daily price and volume Omeros Corporation
| Date |
Closing |
Open |
Range |
Volume |
Thu 04 December 2025 |
11.03 (3.86%) |
10.52 |
10.34 - 11.03 |
0.9474 times |
Wed 03 December 2025 |
10.62 (12.62%) |
9.43 |
9.31 - 10.68 |
1.3247 times |
Tue 02 December 2025 |
9.43 (-2.58%) |
9.67 |
9.42 - 10.08 |
1.051 times |
Mon 01 December 2025 |
9.68 (-0.1%) |
9.83 |
9.56 - 10.41 |
1.9238 times |
Fri 28 November 2025 |
9.69 (0.52%) |
9.68 |
9.57 - 9.93 |
0.444 times |
Wed 26 November 2025 |
9.64 (2.12%) |
9.69 |
9.47 - 9.84 |
0.552 times |
Tue 25 November 2025 |
9.44 (-3.38%) |
9.74 |
9.34 - 9.80 |
0.5547 times |
Mon 24 November 2025 |
9.77 (10.15%) |
8.89 |
8.82 - 10.00 |
1.3365 times |
Fri 21 November 2025 |
8.87 (7.78%) |
8.05 |
8.04 - 8.91 |
0.9155 times |
Thu 20 November 2025 |
8.23 (0.12%) |
8.39 |
8.20 - 8.60 |
0.9504 times |
Wed 19 November 2025 |
8.22 (-3.18%) |
8.41 |
8.20 - 8.74 |
1.0184 times |
Weekly price and charts OmerosCorporation Strong weekly Stock price targets for OmerosCorporation OMER are 10.17 and 11.89 | Weekly Target 1 | 8.74 | | Weekly Target 2 | 9.88 | | Weekly Target 3 | 10.456666666667 | | Weekly Target 4 | 11.6 | | Weekly Target 5 | 12.18 |
Weekly price and volumes for Omeros Corporation
| Date |
Closing |
Open |
Range |
Volume |
Thu 04 December 2025 |
11.03 (13.83%) |
9.83 |
9.31 - 11.03 |
0.3507 times |
Fri 28 November 2025 |
9.69 (9.24%) |
8.89 |
8.82 - 10.00 |
0.193 times |
Fri 21 November 2025 |
8.87 (12.71%) |
7.90 |
7.72 - 9.55 |
0.4785 times |
Fri 14 November 2025 |
7.87 (19.42%) |
6.68 |
6.24 - 7.89 |
0.4605 times |
Fri 07 November 2025 |
6.59 (-10.1%) |
7.06 |
6.25 - 7.24 |
0.2512 times |
Fri 31 October 2025 |
7.33 (0%) |
7.54 |
7.22 - 7.54 |
0.0768 times |
Fri 31 October 2025 |
7.33 (-2.91%) |
7.66 |
7.22 - 8.05 |
0.3385 times |
Fri 24 October 2025 |
7.55 (-7.02%) |
8.18 |
7.00 - 8.43 |
0.4129 times |
Fri 17 October 2025 |
8.12 (93.79%) |
4.30 |
4.06 - 12.10 |
7.1892 times |
Fri 10 October 2025 |
4.19 (-8.32%) |
4.62 |
4.15 - 4.72 |
0.2487 times |
Fri 03 October 2025 |
4.57 (2.47%) |
4.52 |
4.07 - 4.60 |
0.206 times |
Monthly price and charts OmerosCorporation Strong monthly Stock price targets for OmerosCorporation OMER are 10.17 and 11.89 | Monthly Target 1 | 8.74 | | Monthly Target 2 | 9.88 | | Monthly Target 3 | 10.456666666667 | | Monthly Target 4 | 11.6 | | Monthly Target 5 | 12.18 |
Monthly price and volumes Omeros Corporation
| Date |
Closing |
Open |
Range |
Volume |
Thu 04 December 2025 |
11.03 (13.83%) |
9.83 |
9.31 - 11.03 |
0.2024 times |
Fri 28 November 2025 |
9.69 (32.2%) |
7.06 |
6.24 - 10.00 |
0.7982 times |
Fri 31 October 2025 |
7.33 (78.78%) |
4.10 |
4.06 - 12.10 |
4.8443 times |
Tue 30 September 2025 |
4.10 (-1.44%) |
4.14 |
3.94 - 4.54 |
0.5195 times |
Fri 29 August 2025 |
4.16 (7.49%) |
3.83 |
3.52 - 4.58 |
0.6419 times |
Thu 31 July 2025 |
3.87 (29%) |
2.99 |
2.95 - 4.52 |
0.8732 times |
Mon 30 June 2025 |
3.00 (-2.91%) |
3.08 |
2.97 - 4.06 |
0.5061 times |
Fri 30 May 2025 |
3.09 (-57.96%) |
7.37 |
2.97 - 7.37 |
0.8444 times |
Wed 30 April 2025 |
7.35 (-10.58%) |
9.16 |
5.64 - 9.16 |
0.5011 times |
Mon 31 March 2025 |
8.22 (-2.26%) |
8.40 |
6.99 - 9.39 |
0.2689 times |
Fri 28 February 2025 |
8.41 (-2.44%) |
8.37 |
8.21 - 10.03 |
0.2669 times |
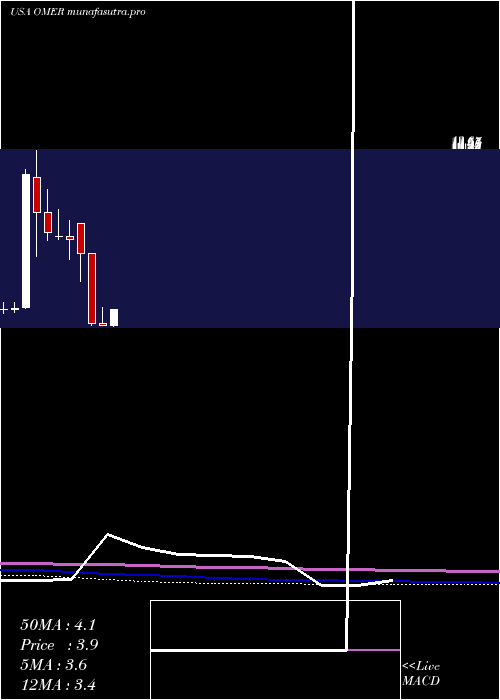
DMA SMA EMA moving averages of Omeros Corporation OMER
DMA (daily moving average) of Omeros Corporation OMER
| DMA period | DMA value | | 5 day DMA | 10.09 | | 12 day DMA | 9.43 | | 20 day DMA | 8.49 | | 35 day DMA | 8.17 | | 50 day DMA | 7.14 | | 100 day DMA | 5.61 | | 150 day DMA | 5.02 | | 200 day DMA | 5.7 | EMA (exponential moving average) of Omeros Corporation OMER
| EMA period | EMA current | EMA prev | EMA prev2 | | 5 day EMA | 10.24 | 9.85 | 9.47 | | 12 day EMA | 9.5 | 9.22 | 8.96 | | 20 day EMA | 8.89 | 8.67 | 8.46 | | 35 day EMA | 7.99 | 7.81 | 7.64 | | 50 day EMA | 7.21 | 7.05 | 6.9 |
SMA (simple moving average) of Omeros Corporation OMER
| SMA period | SMA current | SMA prev | SMA prev2 | | 5 day SMA | 10.09 | 9.81 | 9.58 | | 12 day SMA | 9.43 | 9.26 | 9.03 | | 20 day SMA | 8.49 | 8.29 | 8.1 | | 35 day SMA | 8.17 | 8.16 | 7.97 | | 50 day SMA | 7.14 | 7 | 6.88 | | 100 day SMA | 5.61 | 5.53 | 5.47 | | 150 day SMA | 5.02 | 4.99 | 4.97 | | 200 day SMA | 5.7 | 5.69 | 5.68 |
|
|
