OmnicellInc OMCL full analysis,charts,indicators,moving averages,SMA,DMA,EMA,ADX,MACD,RSIOmnicell Inc OMCL WideScreen charts, DMA,SMA,EMA technical analysis, forecast prediction, by indicators ADX,MACD,RSI,CCI USA stock exchange
operates under Technology sector & deals in Computer Manufacturing
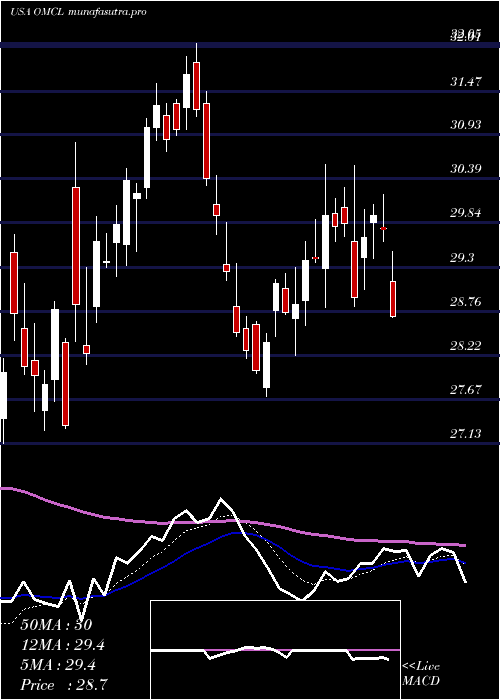
Daily price and charts and targets OmnicellInc Strong Daily Stock price targets for OmnicellInc OMCL are 38.71 and 40.09 | Daily Target 1 | 38.4 | | Daily Target 2 | 39.01 | | Daily Target 3 | 39.783333333333 | | Daily Target 4 | 40.39 | | Daily Target 5 | 41.16 |
Daily price and volume Omnicell Inc
| Date |
Closing |
Open |
Range |
Volume |
Thu 04 December 2025 |
39.61 (-2.15%) |
40.17 |
39.18 - 40.56 |
1.2808 times |
Wed 03 December 2025 |
40.48 (5.25%) |
39.06 |
38.32 - 40.59 |
1.4353 times |
Tue 02 December 2025 |
38.46 (6.48%) |
36.43 |
35.82 - 38.77 |
1.4086 times |
Mon 01 December 2025 |
36.12 (-1.07%) |
36.31 |
35.65 - 36.49 |
0.5374 times |
Fri 28 November 2025 |
36.51 (-0.41%) |
36.59 |
36.33 - 37.17 |
0.2425 times |
Wed 26 November 2025 |
36.66 (-0.92%) |
36.79 |
36.41 - 37.48 |
1.4982 times |
Tue 25 November 2025 |
37.00 (2.1%) |
36.64 |
34.78 - 37.69 |
0.762 times |
Mon 24 November 2025 |
36.24 (0.67%) |
35.76 |
35.76 - 36.59 |
1.0142 times |
Fri 21 November 2025 |
36.00 (4.9%) |
34.41 |
34.38 - 36.84 |
1.1985 times |
Thu 20 November 2025 |
34.32 (-0.61%) |
34.85 |
34.07 - 35.41 |
0.6224 times |
Wed 19 November 2025 |
34.53 (0.32%) |
34.41 |
34.18 - 34.67 |
0.6539 times |
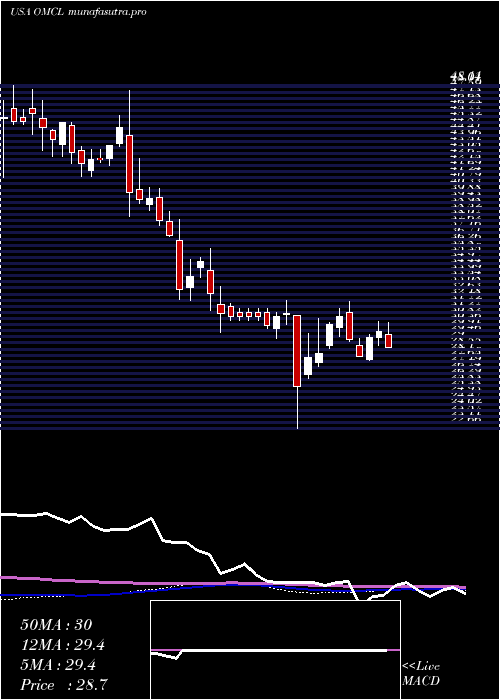
Weekly price and charts OmnicellInc Strong weekly Stock price targets for OmnicellInc OMCL are 37.63 and 42.57 | Weekly Target 1 | 33.68 | | Weekly Target 2 | 36.64 | | Weekly Target 3 | 38.616666666667 | | Weekly Target 4 | 41.58 | | Weekly Target 5 | 43.56 |
Weekly price and volumes for Omnicell Inc
| Date |
Closing |
Open |
Range |
Volume |
Thu 04 December 2025 |
39.61 (8.49%) |
36.31 |
35.65 - 40.59 |
1.1477 times |
Fri 28 November 2025 |
36.51 (1.42%) |
35.76 |
34.78 - 37.69 |
0.8657 times |
Fri 21 November 2025 |
36.00 (2.51%) |
34.90 |
33.25 - 36.84 |
1.0799 times |
Fri 14 November 2025 |
35.12 (-1.57%) |
35.83 |
34.85 - 37.51 |
1.0387 times |
Fri 07 November 2025 |
35.68 (6.29%) |
33.32 |
33.08 - 36.44 |
1.0236 times |
Fri 31 October 2025 |
33.57 (0%) |
33.72 |
32.73 - 34.36 |
0.4965 times |
Fri 31 October 2025 |
33.57 (7.94%) |
31.17 |
29.09 - 34.36 |
1.8395 times |
Fri 24 October 2025 |
31.10 (4.01%) |
30.20 |
29.73 - 31.27 |
0.8182 times |
Fri 17 October 2025 |
29.90 (0.61%) |
29.98 |
29.06 - 30.47 |
0.87 times |
Fri 10 October 2025 |
29.72 (-3.97%) |
30.93 |
29.49 - 31.69 |
0.8202 times |
Fri 03 October 2025 |
30.95 (0.75%) |
31.08 |
29.43 - 31.44 |
0.8382 times |
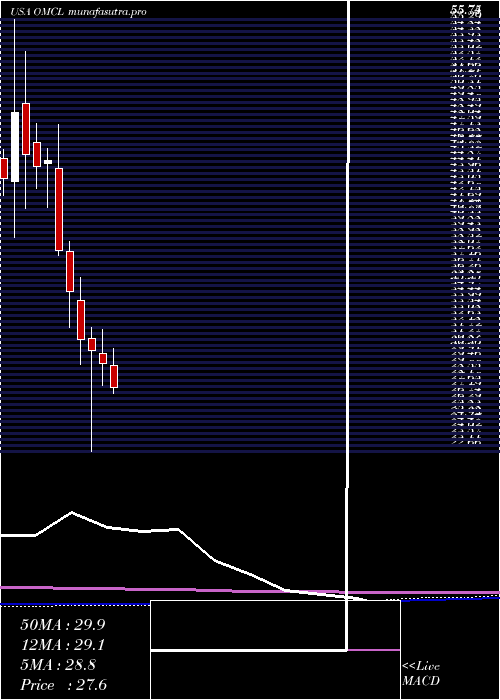
Monthly price and charts OmnicellInc Strong monthly Stock price targets for OmnicellInc OMCL are 37.63 and 42.57 | Monthly Target 1 | 33.68 | | Monthly Target 2 | 36.64 | | Monthly Target 3 | 38.616666666667 | | Monthly Target 4 | 41.58 | | Monthly Target 5 | 43.56 |
Monthly price and volumes Omnicell Inc
| Date |
Closing |
Open |
Range |
Volume |
Thu 04 December 2025 |
39.61 (8.49%) |
36.31 |
35.65 - 40.59 |
0.1965 times |
Fri 28 November 2025 |
36.51 (8.76%) |
33.32 |
33.08 - 37.69 |
0.6861 times |
Fri 31 October 2025 |
33.57 (10.25%) |
30.35 |
29.06 - 34.36 |
0.9151 times |
Tue 30 September 2025 |
30.45 (-6.57%) |
32.19 |
30.01 - 33.43 |
1.0068 times |
Fri 29 August 2025 |
32.59 (5.1%) |
30.72 |
29.51 - 33.75 |
1.1607 times |
Thu 31 July 2025 |
31.01 (5.48%) |
29.28 |
26.88 - 33.99 |
1.0236 times |
Mon 30 June 2025 |
29.40 (-3.19%) |
30.14 |
27.70 - 32.05 |
0.9259 times |
Fri 30 May 2025 |
30.37 (-2.85%) |
31.35 |
22.66 - 32.18 |
1.7287 times |
Wed 30 April 2025 |
31.26 (-10.58%) |
34.27 |
29.30 - 35.98 |
1.1283 times |
Mon 31 March 2025 |
34.96 (-8.15%) |
37.99 |
32.15 - 38.78 |
1.2285 times |
Fri 28 February 2025 |
38.06 (-15.4%) |
44.38 |
37.69 - 47.69 |
0.9094 times |
DMA SMA EMA moving averages of Omnicell Inc OMCL
DMA (daily moving average) of Omnicell Inc OMCL
| DMA period | DMA value | | 5 day DMA | 38.24 | | 12 day DMA | 36.7 | | 20 day DMA | 36.37 | | 35 day DMA | 34.35 | | 50 day DMA | 33.15 | | 100 day DMA | 32.13 | | 150 day DMA | 31.1 | | 200 day DMA | 31.85 | EMA (exponential moving average) of Omnicell Inc OMCL
| EMA period | EMA current | EMA prev | EMA prev2 | | 5 day EMA | 38.64 | 38.15 | 36.99 | | 12 day EMA | 37.27 | 36.85 | 36.19 | | 20 day EMA | 36.32 | 35.97 | 35.49 | | 35 day EMA | 34.89 | 34.61 | 34.26 | | 50 day EMA | 33.52 | 33.27 | 32.98 |
SMA (simple moving average) of Omnicell Inc OMCL
| SMA period | SMA current | SMA prev | SMA prev2 | | 5 day SMA | 38.24 | 37.65 | 36.95 | | 12 day SMA | 36.7 | 36.24 | 35.8 | | 20 day SMA | 36.37 | 36.18 | 35.88 | | 35 day SMA | 34.35 | 34.07 | 33.77 | | 50 day SMA | 33.15 | 32.97 | 32.78 | | 100 day SMA | 32.13 | 32.01 | 31.88 | | 150 day SMA | 31.1 | 31.04 | 30.98 | | 200 day SMA | 31.85 | 31.85 | 31.85 |
|
|
