GrupoAeroportuario OMAB full analysis,charts,indicators,moving averages,SMA,DMA,EMA,ADX,MACD,RSIGrupo Aeroportuario OMAB WideScreen charts, DMA,SMA,EMA technical analysis, forecast prediction, by indicators ADX,MACD,RSI,CCI USA stock exchange
operates under Transportation sector & deals in Aerospace
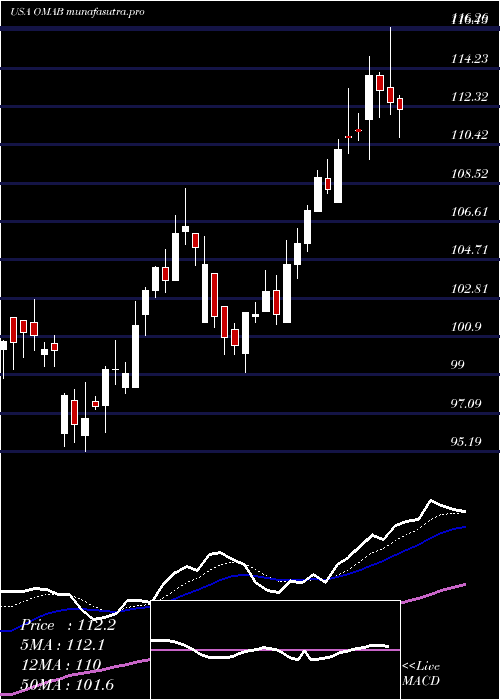
Daily price and charts and targets GrupoAeroportuario Strong Daily Stock price targets for GrupoAeroportuario OMAB are 101.38 and 103.75 | Daily Target 1 | 100.88 | | Daily Target 2 | 101.87 | | Daily Target 3 | 103.25 | | Daily Target 4 | 104.24 | | Daily Target 5 | 105.62 |
Daily price and volume Grupo Aeroportuario
| Date |
Closing |
Open |
Range |
Volume |
Thu 04 December 2025 |
102.86 (-1.69%) |
104.63 |
102.26 - 104.63 |
1.1297 times |
Wed 03 December 2025 |
104.63 (-1.41%) |
106.13 |
103.88 - 106.29 |
1.0842 times |
Tue 02 December 2025 |
106.13 (-1%) |
107.20 |
105.47 - 107.21 |
1.384 times |
Mon 01 December 2025 |
107.20 (-0.33%) |
106.67 |
105.71 - 108.00 |
0.713 times |
Fri 28 November 2025 |
107.56 (0.52%) |
107.00 |
105.64 - 107.72 |
0.5302 times |
Wed 26 November 2025 |
107.00 (-1.19%) |
105.17 |
105.05 - 108.75 |
0.6551 times |
Tue 25 November 2025 |
108.29 (4.86%) |
103.20 |
102.59 - 108.70 |
2.0084 times |
Mon 24 November 2025 |
103.27 (1.05%) |
102.20 |
101.16 - 103.46 |
0.7391 times |
Fri 21 November 2025 |
102.20 (0.87%) |
101.94 |
101.18 - 103.13 |
1.1455 times |
Thu 20 November 2025 |
101.32 (-1.12%) |
103.50 |
100.66 - 103.91 |
0.6108 times |
Wed 19 November 2025 |
102.47 (-0.31%) |
102.27 |
101.83 - 103.88 |
0.4348 times |
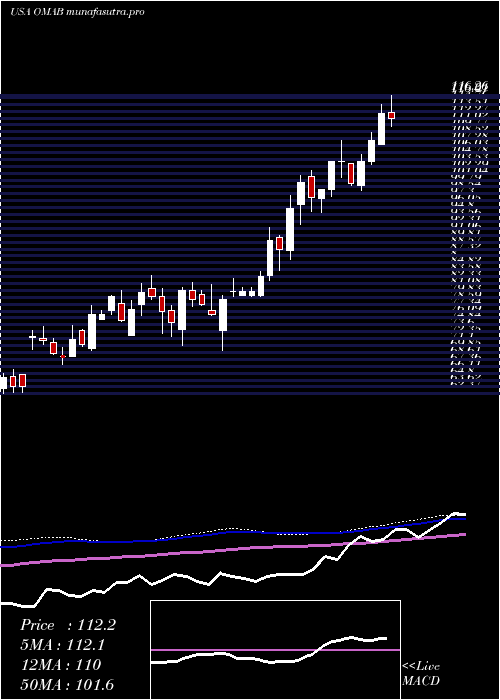
Weekly price and charts GrupoAeroportuario Strong weekly Stock price targets for GrupoAeroportuario OMAB are 99.69 and 105.43 | Weekly Target 1 | 98.63 | | Weekly Target 2 | 100.75 | | Weekly Target 3 | 104.37333333333 | | Weekly Target 4 | 106.49 | | Weekly Target 5 | 110.11 |
Weekly price and volumes for Grupo Aeroportuario
| Date |
Closing |
Open |
Range |
Volume |
Thu 04 December 2025 |
102.86 (-4.37%) |
106.67 |
102.26 - 108.00 |
1.1629 times |
Fri 28 November 2025 |
107.56 (5.24%) |
102.20 |
101.16 - 108.75 |
1.0609 times |
Fri 21 November 2025 |
102.20 (-3.03%) |
105.86 |
100.66 - 106.13 |
0.9538 times |
Fri 14 November 2025 |
105.39 (0.98%) |
103.83 |
102.10 - 107.78 |
0.8429 times |
Fri 07 November 2025 |
104.37 (5.83%) |
95.69 |
95.69 - 108.39 |
0.8141 times |
Fri 31 October 2025 |
98.62 (0%) |
98.00 |
97.65 - 99.29 |
0.2885 times |
Fri 31 October 2025 |
98.62 (-3.98%) |
102.71 |
97.65 - 103.52 |
1.1204 times |
Fri 24 October 2025 |
102.71 (-1.65%) |
104.32 |
98.82 - 104.89 |
1.2968 times |
Fri 17 October 2025 |
104.43 (-0.59%) |
105.24 |
101.05 - 106.00 |
1.1917 times |
Fri 10 October 2025 |
105.05 (3.79%) |
101.21 |
100.20 - 108.22 |
1.268 times |
Fri 03 October 2025 |
101.21 (-3.21%) |
105.24 |
100.50 - 105.44 |
1.7671 times |
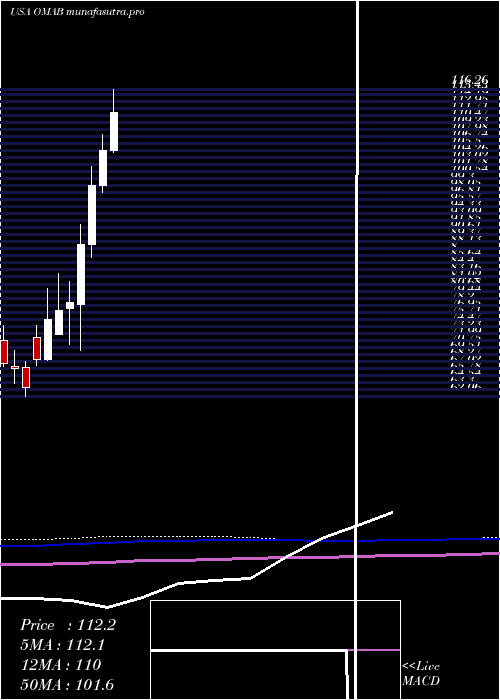
Monthly price and charts GrupoAeroportuario Strong monthly Stock price targets for GrupoAeroportuario OMAB are 99.69 and 105.43 | Monthly Target 1 | 98.63 | | Monthly Target 2 | 100.75 | | Monthly Target 3 | 104.37333333333 | | Monthly Target 4 | 106.49 | | Monthly Target 5 | 110.11 |
Monthly price and volumes Grupo Aeroportuario
| Date |
Closing |
Open |
Range |
Volume |
Thu 04 December 2025 |
102.86 (-4.37%) |
106.67 |
102.26 - 108.00 |
0.2548 times |
Fri 28 November 2025 |
107.56 (9.07%) |
95.69 |
95.69 - 108.75 |
0.8044 times |
Fri 31 October 2025 |
98.62 (-5.05%) |
103.32 |
97.65 - 108.22 |
1.2369 times |
Tue 30 September 2025 |
103.87 (1.62%) |
102.02 |
100.50 - 113.18 |
1.5662 times |
Fri 29 August 2025 |
102.21 (-3.97%) |
106.23 |
101.87 - 110.51 |
0.8888 times |
Thu 31 July 2025 |
106.43 (0.88%) |
105.50 |
101.05 - 116.26 |
1.2738 times |
Mon 30 June 2025 |
105.50 (6.29%) |
99.26 |
98.07 - 108.23 |
0.8473 times |
Fri 30 May 2025 |
99.26 (11.57%) |
88.97 |
86.62 - 102.74 |
1.1893 times |
Wed 30 April 2025 |
88.97 (13.15%) |
78.23 |
70.24 - 92.39 |
1.1551 times |
Mon 31 March 2025 |
78.63 (1.81%) |
77.52 |
71.18 - 82.43 |
0.7834 times |
Fri 28 February 2025 |
77.23 (2.16%) |
73.01 |
73.00 - 83.69 |
0.8795 times |
DMA SMA EMA moving averages of Grupo Aeroportuario OMAB
DMA (daily moving average) of Grupo Aeroportuario OMAB
| DMA period | DMA value | | 5 day DMA | 105.68 | | 12 day DMA | 104.64 | | 20 day DMA | 104.76 | | 35 day DMA | 103.52 | | 50 day DMA | 103.41 | | 100 day DMA | 105.04 | | 150 day DMA | 103.99 | | 200 day DMA | 97.93 | EMA (exponential moving average) of Grupo Aeroportuario OMAB
| EMA period | EMA current | EMA prev | EMA prev2 | | 5 day EMA | 104.81 | 105.79 | 106.37 | | 12 day EMA | 104.91 | 105.28 | 105.4 | | 20 day EMA | 104.57 | 104.75 | 104.76 | | 35 day EMA | 104.3 | 104.38 | 104.36 | | 50 day EMA | 103.9 | 103.94 | 103.91 |
SMA (simple moving average) of Grupo Aeroportuario OMAB
| SMA period | SMA current | SMA prev | SMA prev2 | | 5 day SMA | 105.68 | 106.5 | 107.24 | | 12 day SMA | 104.64 | 104.75 | 104.81 | | 20 day SMA | 104.76 | 104.97 | 104.7 | | 35 day SMA | 103.52 | 103.54 | 103.49 | | 50 day SMA | 103.41 | 103.42 | 103.51 | | 100 day SMA | 105.04 | 105.14 | 105.21 | | 150 day SMA | 103.99 | 103.89 | 103.77 | | 200 day SMA | 97.93 | 97.82 | 97.69 |
|
|
