OllieS OLLI full analysis,charts,indicators,moving averages,SMA,DMA,EMA,ADX,MACD,RSIOllie S OLLI WideScreen charts, DMA,SMA,EMA technical analysis, forecast prediction, by indicators ADX,MACD,RSI,CCI USA stock exchange
operates under Consumer Services sector & deals in Department Specialty Retail Stores
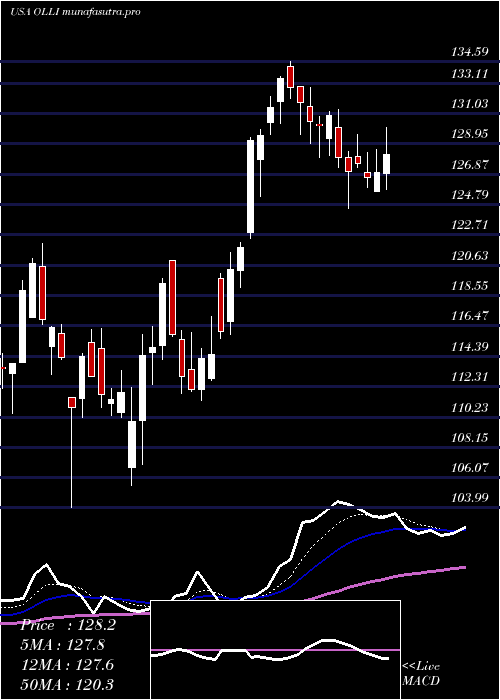
Daily price and charts and targets OllieS Strong Daily Stock price targets for OllieS OLLI are 114.48 and 119.37 | Daily Target 1 | 113.22 | | Daily Target 2 | 115.73 | | Daily Target 3 | 118.11 | | Daily Target 4 | 120.62 | | Daily Target 5 | 123 |
Daily price and volume Ollie S
| Date |
Closing |
Open |
Range |
Volume |
Thu 04 December 2025 |
118.24 (-0.11%) |
118.46 |
115.60 - 120.49 |
1.1611 times |
Wed 03 December 2025 |
118.37 (-1.13%) |
119.78 |
117.86 - 121.77 |
1.2516 times |
Tue 02 December 2025 |
119.72 (-1.59%) |
122.38 |
119.64 - 122.38 |
1.0589 times |
Mon 01 December 2025 |
121.65 (-1.19%) |
122.58 |
120.14 - 123.69 |
1.0255 times |
Fri 28 November 2025 |
123.11 (-1.69%) |
126.13 |
122.82 - 126.13 |
0.375 times |
Wed 26 November 2025 |
125.22 (1.39%) |
123.04 |
123.04 - 126.32 |
0.8315 times |
Tue 25 November 2025 |
123.50 (2.19%) |
120.30 |
118.34 - 124.19 |
1.5373 times |
Mon 24 November 2025 |
120.85 (-2.81%) |
124.37 |
119.80 - 124.64 |
1.2748 times |
Fri 21 November 2025 |
124.34 (2.89%) |
121.52 |
121.52 - 125.15 |
0.7848 times |
Thu 20 November 2025 |
120.85 (0.98%) |
120.53 |
119.96 - 122.53 |
0.6994 times |
Wed 19 November 2025 |
119.68 (-1.52%) |
121.56 |
118.93 - 123.53 |
0.8021 times |
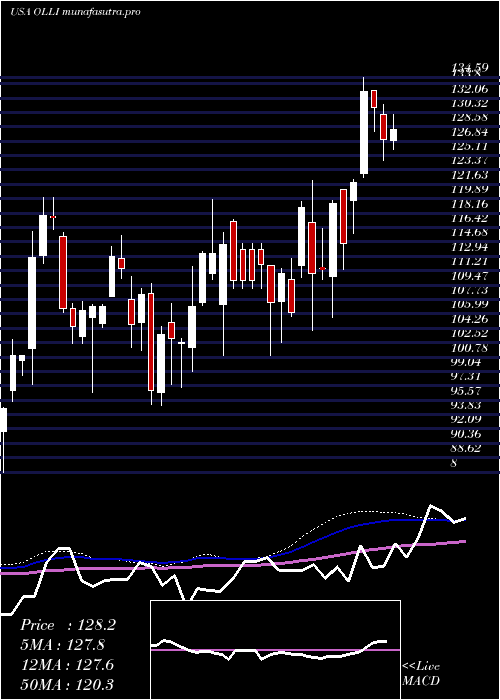
Weekly price and charts OllieS Strong weekly Stock price targets for OllieS OLLI are 112.88 and 120.97 | Weekly Target 1 | 111.09 | | Weekly Target 2 | 114.66 | | Weekly Target 3 | 119.17666666667 | | Weekly Target 4 | 122.75 | | Weekly Target 5 | 127.27 |
Weekly price and volumes for Ollie S
| Date |
Closing |
Open |
Range |
Volume |
Thu 04 December 2025 |
118.24 (-3.96%) |
122.58 |
115.60 - 123.69 |
0.9279 times |
Fri 28 November 2025 |
123.11 (-0.99%) |
124.37 |
118.34 - 126.32 |
0.8292 times |
Fri 21 November 2025 |
124.34 (-0.26%) |
124.37 |
100.00 - 125.48 |
0.7814 times |
Fri 14 November 2025 |
124.67 (0.98%) |
124.36 |
124.00 - 130.40 |
1.0141 times |
Fri 07 November 2025 |
123.46 (2.19%) |
122.58 |
120.26 - 128.12 |
1.1327 times |
Fri 31 October 2025 |
120.81 (0%) |
122.00 |
120.39 - 122.46 |
0.234 times |
Fri 31 October 2025 |
120.81 (3.14%) |
119.72 |
118.78 - 125.92 |
1.2089 times |
Fri 24 October 2025 |
117.13 (-5.96%) |
125.75 |
115.55 - 125.89 |
1.2494 times |
Fri 17 October 2025 |
124.56 (-0.03%) |
126.00 |
121.61 - 133.28 |
1.1903 times |
Fri 10 October 2025 |
124.60 (-5.19%) |
131.55 |
122.67 - 132.39 |
1.4319 times |
Fri 03 October 2025 |
131.42 (-0.74%) |
133.05 |
126.23 - 133.35 |
1.4056 times |
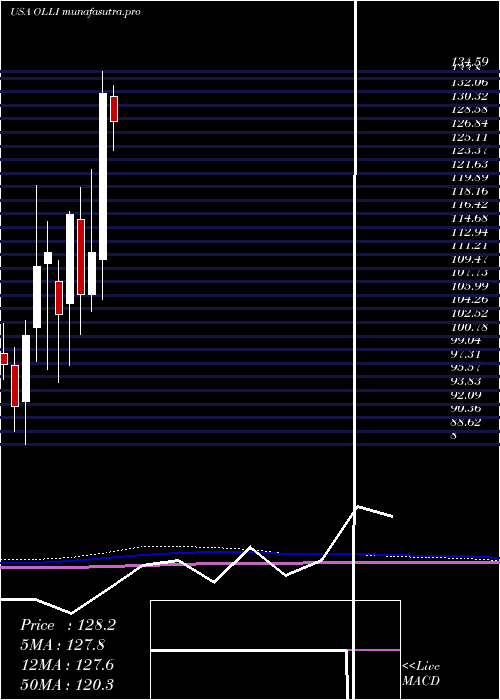
Monthly price and charts OllieS Strong monthly Stock price targets for OllieS OLLI are 112.88 and 120.97 | Monthly Target 1 | 111.09 | | Monthly Target 2 | 114.66 | | Monthly Target 3 | 119.17666666667 | | Monthly Target 4 | 122.75 | | Monthly Target 5 | 127.27 |
Monthly price and volumes Ollie S
| Date |
Closing |
Open |
Range |
Volume |
Thu 04 December 2025 |
118.24 (-3.96%) |
122.58 |
115.60 - 123.69 |
0.1702 times |
Fri 28 November 2025 |
123.11 (1.9%) |
122.58 |
100.00 - 130.40 |
0.6891 times |
Fri 31 October 2025 |
120.81 (-5.91%) |
128.20 |
115.55 - 133.28 |
1.1186 times |
Tue 30 September 2025 |
128.40 (1.23%) |
126.00 |
124.63 - 139.21 |
1.0451 times |
Fri 29 August 2025 |
126.84 (-7.17%) |
133.71 |
125.91 - 141.74 |
1.1056 times |
Thu 31 July 2025 |
136.63 (3.68%) |
131.50 |
122.94 - 140.25 |
0.8899 times |
Mon 30 June 2025 |
131.78 (18.24%) |
110.56 |
105.50 - 134.59 |
1.3224 times |
Fri 30 May 2025 |
111.45 (5.03%) |
106.17 |
103.99 - 122.15 |
1.1659 times |
Wed 30 April 2025 |
106.11 (-8.81%) |
115.74 |
100.94 - 119.76 |
1.3933 times |
Mon 31 March 2025 |
116.36 (12.41%) |
104.98 |
97.04 - 116.79 |
1.0998 times |
Fri 28 February 2025 |
103.51 (-7.17%) |
107.73 |
94.88 - 110.48 |
0.7756 times |
DMA SMA EMA moving averages of Ollie S OLLI
DMA (daily moving average) of Ollie S OLLI
| DMA period | DMA value | | 5 day DMA | 120.22 | | 12 day DMA | 121.42 | | 20 day DMA | 122.97 | | 35 day DMA | 122.61 | | 50 day DMA | 124.44 | | 100 day DMA | 128.99 | | 150 day DMA | 125.55 | | 200 day DMA | 120.88 | EMA (exponential moving average) of Ollie S OLLI
| EMA period | EMA current | EMA prev | EMA prev2 | | 5 day EMA | 119.83 | 120.62 | 121.75 | | 12 day EMA | 121.34 | 121.9 | 122.54 | | 20 day EMA | 122.18 | 122.6 | 123.05 | | 35 day EMA | 123.76 | 124.08 | 124.42 | | 50 day EMA | 124.87 | 125.14 | 125.42 |
SMA (simple moving average) of Ollie S OLLI
| SMA period | SMA current | SMA prev | SMA prev2 | | 5 day SMA | 120.22 | 121.61 | 122.64 | | 12 day SMA | 121.42 | 121.81 | 122.33 | | 20 day SMA | 122.97 | 123.26 | 123.54 | | 35 day SMA | 122.61 | 122.84 | 123.14 | | 50 day SMA | 124.44 | 124.77 | 125.03 | | 100 day SMA | 128.99 | 129.04 | 129.14 | | 150 day SMA | 125.55 | 125.47 | 125.38 | | 200 day SMA | 120.88 | 120.83 | 120.77 |
|
|
