OceaneeringInternational OII full analysis,charts,indicators,moving averages,SMA,DMA,EMA,ADX,MACD,RSIOceaneering International OII WideScreen charts, DMA,SMA,EMA technical analysis, forecast prediction, by indicators ADX,MACD,RSI,CCI USA stock exchange
operates under Energy sector & deals in Oilfield Services Equipment
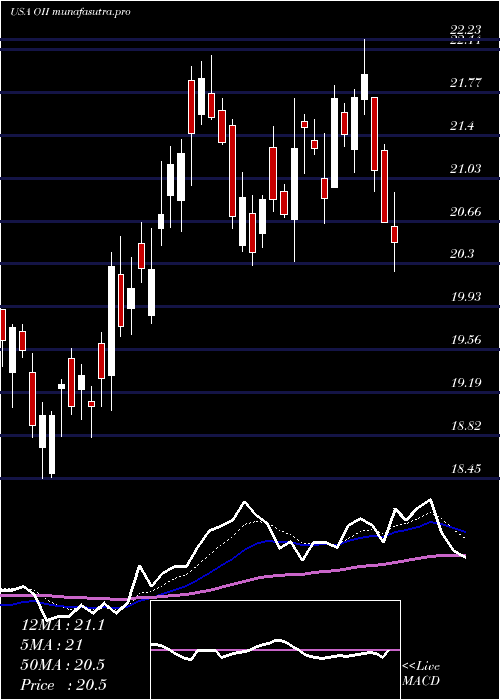
Daily price and charts and targets OceaneeringInternational Strong Daily Stock price targets for OceaneeringInternational OII are 23.3 and 23.84 | Daily Target 1 | 22.85 | | Daily Target 2 | 23.21 | | Daily Target 3 | 23.393333333333 | | Daily Target 4 | 23.75 | | Daily Target 5 | 23.93 |
Daily price and volume Oceaneering International
| Date |
Closing |
Open |
Range |
Volume |
Mon 20 October 2025 |
23.56 (1.95%) |
23.11 |
23.04 - 23.58 |
0.8857 times |
Fri 17 October 2025 |
23.11 (2.48%) |
22.27 |
22.24 - 23.31 |
1.3055 times |
Thu 16 October 2025 |
22.55 (-0.49%) |
22.74 |
22.31 - 22.79 |
1.3561 times |
Wed 15 October 2025 |
22.66 (1.93%) |
22.41 |
22.34 - 22.80 |
0.7865 times |
Tue 14 October 2025 |
22.23 (-1.68%) |
22.04 |
22.02 - 22.39 |
0.8194 times |
Mon 13 October 2025 |
22.61 (-7.26%) |
22.62 |
22.12 - 22.70 |
0.8689 times |
Tue 07 October 2025 |
24.38 (0.08%) |
24.22 |
23.82 - 24.55 |
1.2962 times |
Mon 06 October 2025 |
24.36 (0%) |
24.65 |
24.30 - 24.74 |
0.4312 times |
Fri 03 October 2025 |
24.36 (0.83%) |
24.40 |
24.35 - 24.98 |
1.3968 times |
Thu 02 October 2025 |
24.16 (-4.2%) |
25.15 |
24.15 - 25.50 |
0.8537 times |
Wed 01 October 2025 |
25.22 (1.78%) |
24.40 |
24.40 - 25.33 |
0.947 times |
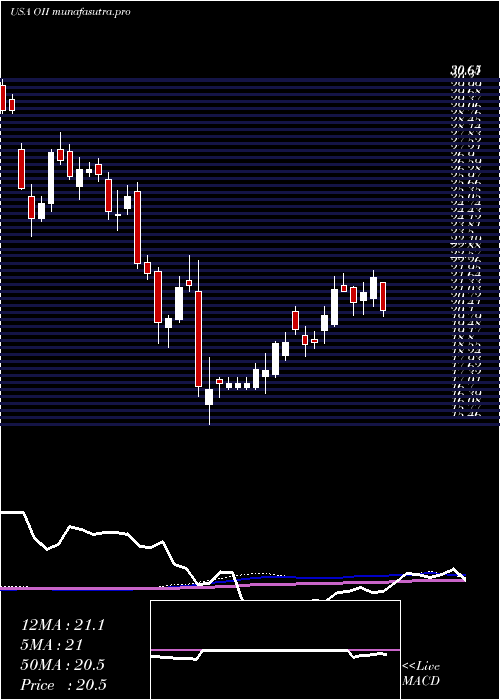
Weekly price and charts OceaneeringInternational Strong weekly Stock price targets for OceaneeringInternational OII are 23.3 and 23.84 | Weekly Target 1 | 22.85 | | Weekly Target 2 | 23.21 | | Weekly Target 3 | 23.393333333333 | | Weekly Target 4 | 23.75 | | Weekly Target 5 | 23.93 |
Weekly price and volumes for Oceaneering International
| Date |
Closing |
Open |
Range |
Volume |
Mon 20 October 2025 |
23.56 (1.95%) |
23.11 |
23.04 - 23.58 |
0.2219 times |
Fri 17 October 2025 |
23.11 (-5.21%) |
22.62 |
22.02 - 23.31 |
1.2871 times |
Tue 07 October 2025 |
24.38 (0.08%) |
24.65 |
23.82 - 24.74 |
0.4329 times |
Fri 03 October 2025 |
24.36 (-5.07%) |
25.38 |
24.15 - 25.65 |
1.2599 times |
Fri 26 September 2025 |
25.66 (5.34%) |
24.10 |
23.93 - 26.30 |
1.2104 times |
Fri 19 September 2025 |
24.36 (0.41%) |
24.44 |
23.81 - 24.86 |
1.8653 times |
Fri 12 September 2025 |
24.26 (0.83%) |
24.03 |
23.51 - 24.79 |
1.1297 times |
Fri 05 September 2025 |
24.06 (-1.39%) |
24.22 |
23.43 - 24.79 |
0.9901 times |
Fri 29 August 2025 |
24.40 (0%) |
24.56 |
24.26 - 24.71 |
0.2099 times |
Fri 29 August 2025 |
24.40 (1.71%) |
23.98 |
23.59 - 24.83 |
1.3927 times |
Fri 22 August 2025 |
23.99 (7.19%) |
22.30 |
22.12 - 24.21 |
1.2072 times |
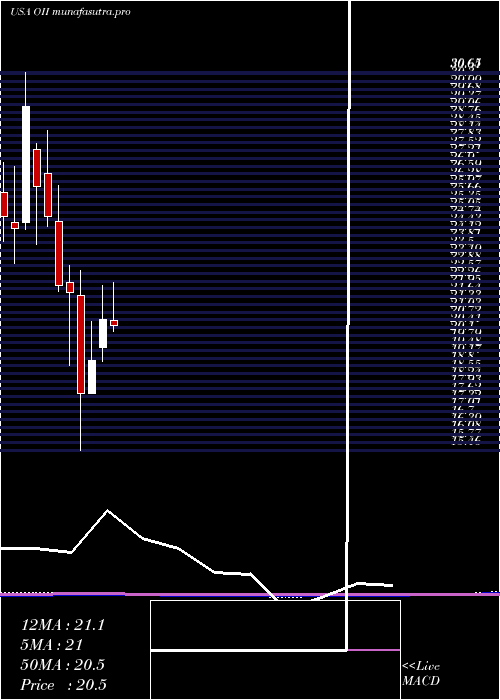
Monthly price and charts OceaneeringInternational Strong monthly Stock price targets for OceaneeringInternational OII are 21.05 and 24.53 | Monthly Target 1 | 20.21 | | Monthly Target 2 | 21.89 | | Monthly Target 3 | 23.693333333333 | | Monthly Target 4 | 25.37 | | Monthly Target 5 | 27.17 |
Monthly price and volumes Oceaneering International
| Date |
Closing |
Open |
Range |
Volume |
Mon 20 October 2025 |
23.56 (-4.92%) |
24.40 |
22.02 - 25.50 |
0.4006 times |
Tue 30 September 2025 |
24.78 (1.56%) |
24.22 |
23.43 - 26.30 |
0.8257 times |
Fri 29 August 2025 |
24.40 (12.44%) |
21.67 |
20.79 - 24.83 |
0.8611 times |
Thu 31 July 2025 |
21.70 (4.73%) |
20.68 |
20.21 - 24.21 |
1.1568 times |
Mon 30 June 2025 |
20.72 (8.65%) |
19.61 |
19.03 - 22.09 |
1.0024 times |
Fri 30 May 2025 |
19.07 (7.44%) |
17.75 |
17.75 - 20.64 |
0.8329 times |
Wed 30 April 2025 |
17.75 (-18.62%) |
21.69 |
15.46 - 22.69 |
1.527 times |
Mon 31 March 2025 |
21.81 (-1.27%) |
22.20 |
18.87 - 22.88 |
1.3904 times |
Fri 28 February 2025 |
22.09 (-11.11%) |
24.66 |
21.86 - 26.11 |
1.0442 times |
Fri 31 January 2025 |
24.85 (-4.72%) |
26.60 |
24.48 - 28.31 |
0.959 times |
Tue 31 December 2024 |
26.08 (-10.96%) |
27.57 |
23.76 - 27.82 |
0.8068 times |
DMA SMA EMA moving averages of Oceaneering International OII
DMA (daily moving average) of Oceaneering International OII
| DMA period | DMA value | | 5 day DMA | 22.82 | | 12 day DMA | 23.67 | | 20 day DMA | 24.2 | | 35 day DMA | 24.24 | | 50 day DMA | 23.77 | | 100 day DMA | 22.38 | | 150 day DMA | 21.26 | | 200 day DMA | 22.08 | EMA (exponential moving average) of Oceaneering International OII
| EMA period | EMA current | EMA prev | EMA prev2 | | 5 day EMA | 23.17 | 22.98 | 22.92 | | 12 day EMA | 23.53 | 23.52 | 23.6 | | 20 day EMA | 23.77 | 23.79 | 23.86 | | 35 day EMA | 23.74 | 23.75 | 23.79 | | 50 day EMA | 23.52 | 23.52 | 23.54 |
SMA (simple moving average) of Oceaneering International OII
| SMA period | SMA current | SMA prev | SMA prev2 | | 5 day SMA | 22.82 | 22.63 | 22.89 | | 12 day SMA | 23.67 | 23.79 | 24 | | 20 day SMA | 24.2 | 24.24 | 24.3 | | 35 day SMA | 24.24 | 24.26 | 24.28 | | 50 day SMA | 23.77 | 23.74 | 23.72 | | 100 day SMA | 22.38 | 22.33 | 22.3 | | 150 day SMA | 21.26 | 21.24 | 21.21 | | 200 day SMA | 22.08 | 22.09 | 22.1 |
|
|
