OfsCapital OFS full analysis,charts,indicators,moving averages,SMA,DMA,EMA,ADX,MACD,RSIOfs Capital OFS WideScreen charts, DMA,SMA,EMA technical analysis, forecast prediction, by indicators ADX,MACD,RSI,CCI USA stock exchange
operates under N A sector & deals in N A
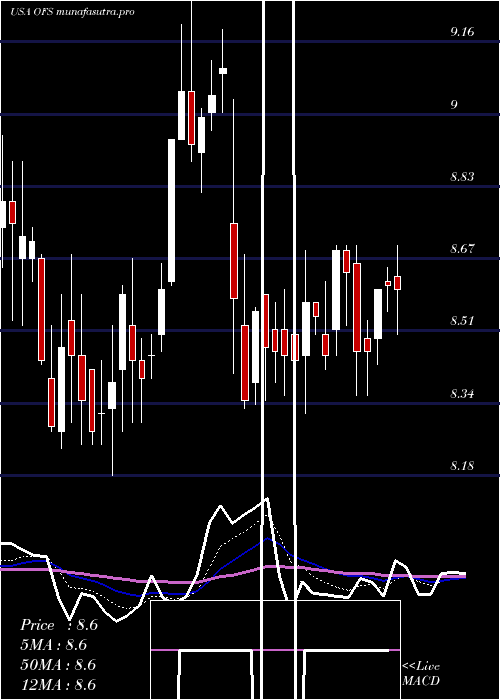
Daily price and charts and targets OfsCapital Strong Daily Stock price targets for OfsCapital OFS are 6.78 and 6.92 | Daily Target 1 | 6.74 | | Daily Target 2 | 6.81 | | Daily Target 3 | 6.8833333333333 | | Daily Target 4 | 6.95 | | Daily Target 5 | 7.02 |
Daily price and volume Ofs Capital
| Date |
Closing |
Open |
Range |
Volume |
Mon 20 October 2025 |
6.87 (-1.15%) |
6.90 |
6.82 - 6.96 |
1.0542 times |
Fri 17 October 2025 |
6.95 (0.14%) |
7.00 |
6.86 - 7.00 |
0.8133 times |
Thu 16 October 2025 |
6.94 (-1.14%) |
7.07 |
6.92 - 7.10 |
0.9528 times |
Wed 15 October 2025 |
7.02 (-2.5%) |
7.19 |
7.01 - 7.21 |
1.4886 times |
Tue 14 October 2025 |
7.20 (-0.41%) |
7.21 |
7.15 - 7.29 |
0.8878 times |
Mon 13 October 2025 |
7.23 (0.56%) |
7.22 |
7.18 - 7.29 |
0.5691 times |
Fri 10 October 2025 |
7.19 (-0.96%) |
7.21 |
7.19 - 7.39 |
0.8782 times |
Thu 09 October 2025 |
7.26 (-2.94%) |
7.43 |
7.24 - 7.54 |
1.4981 times |
Wed 08 October 2025 |
7.48 (-0.66%) |
7.59 |
7.40 - 7.62 |
1.0701 times |
Tue 07 October 2025 |
7.53 (-1.7%) |
7.65 |
7.51 - 7.65 |
0.7879 times |
Mon 06 October 2025 |
7.66 (0.26%) |
7.63 |
7.62 - 7.75 |
0.8006 times |
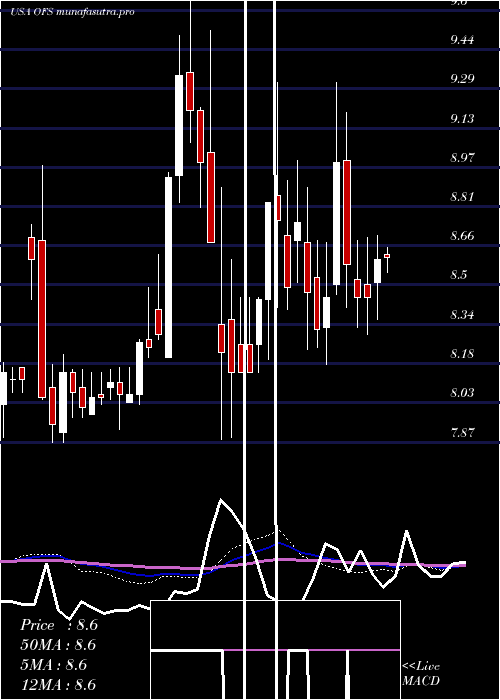
Weekly price and charts OfsCapital Strong weekly Stock price targets for OfsCapital OFS are 6.78 and 6.92 | Weekly Target 1 | 6.74 | | Weekly Target 2 | 6.81 | | Weekly Target 3 | 6.8833333333333 | | Weekly Target 4 | 6.95 | | Weekly Target 5 | 7.02 |
Weekly price and volumes for Ofs Capital
| Date |
Closing |
Open |
Range |
Volume |
Mon 20 October 2025 |
6.87 (-1.15%) |
6.90 |
6.82 - 6.96 |
0.2739 times |
Fri 17 October 2025 |
6.95 (-3.34%) |
7.22 |
6.86 - 7.29 |
1.2243 times |
Fri 10 October 2025 |
7.19 (-5.89%) |
7.63 |
7.19 - 7.75 |
1.3083 times |
Fri 03 October 2025 |
7.64 (-2.05%) |
7.93 |
7.53 - 7.96 |
1.6586 times |
Fri 26 September 2025 |
7.80 (-6.25%) |
8.35 |
7.70 - 8.36 |
1.2725 times |
Fri 19 September 2025 |
8.32 (-4.81%) |
8.77 |
8.21 - 8.99 |
2.0914 times |
Fri 12 September 2025 |
8.74 (0.46%) |
8.73 |
8.59 - 8.79 |
0.8144 times |
Fri 05 September 2025 |
8.70 (2.47%) |
8.50 |
8.45 - 8.73 |
0.6294 times |
Fri 29 August 2025 |
8.49 (0%) |
8.35 |
8.35 - 8.49 |
0.1335 times |
Fri 29 August 2025 |
8.49 (2.04%) |
8.33 |
8.30 - 8.49 |
0.5936 times |
Fri 22 August 2025 |
8.32 (0.24%) |
8.31 |
8.20 - 8.41 |
0.6678 times |
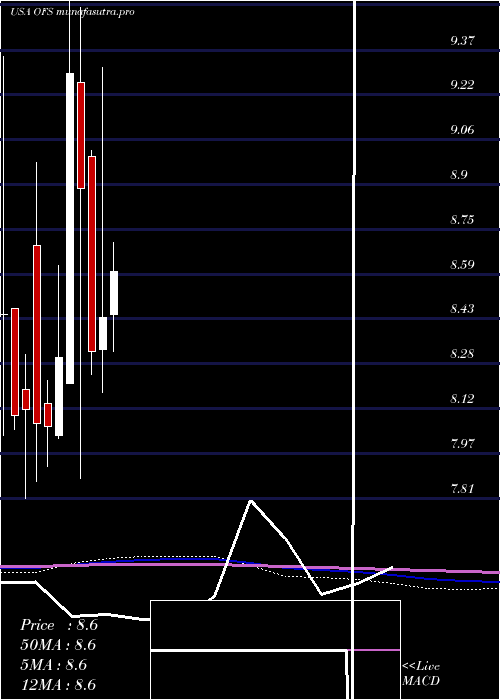
Monthly price and charts OfsCapital Strong monthly Stock price targets for OfsCapital OFS are 6.35 and 7.34 | Monthly Target 1 | 6.18 | | Monthly Target 2 | 6.52 | | Monthly Target 3 | 7.1666666666667 | | Monthly Target 4 | 7.51 | | Monthly Target 5 | 8.16 |
Monthly price and volumes Ofs Capital
| Date |
Closing |
Open |
Range |
Volume |
Mon 20 October 2025 |
6.87 (-10.66%) |
7.63 |
6.82 - 7.81 |
0.852 times |
Tue 30 September 2025 |
7.69 (-9.42%) |
8.50 |
7.58 - 8.99 |
1.3576 times |
Fri 29 August 2025 |
8.49 (0.12%) |
8.51 |
8.18 - 8.51 |
0.6814 times |
Thu 31 July 2025 |
8.48 (0.47%) |
8.45 |
8.17 - 8.70 |
0.9501 times |
Mon 30 June 2025 |
8.44 (1.44%) |
8.33 |
8.18 - 9.31 |
1.1227 times |
Fri 30 May 2025 |
8.32 (-6.41%) |
9.00 |
8.24 - 9.02 |
0.8325 times |
Wed 30 April 2025 |
8.89 (-4.31%) |
9.26 |
7.88 - 9.52 |
1.0618 times |
Mon 31 March 2025 |
9.29 (11.93%) |
8.21 |
8.21 - 9.80 |
1.7821 times |
Fri 28 February 2025 |
8.30 (2.98%) |
8.03 |
8.02 - 8.62 |
0.5996 times |
Fri 31 January 2025 |
8.06 (-0.12%) |
8.14 |
7.92 - 8.22 |
0.7602 times |
Tue 31 December 2024 |
8.07 (-0.62%) |
8.69 |
7.87 - 8.98 |
1.2581 times |
DMA SMA EMA moving averages of Ofs Capital OFS
DMA (daily moving average) of Ofs Capital OFS
| DMA period | DMA value | | 5 day DMA | 7 | | 12 day DMA | 7.25 | | 20 day DMA | 7.48 | | 35 day DMA | 7.98 | | 50 day DMA | 8.08 | | 100 day DMA | 8.3 | | 150 day DMA | 8.44 | | 200 day DMA | 8.4 | EMA (exponential moving average) of Ofs Capital OFS
| EMA period | EMA current | EMA prev | EMA prev2 | | 5 day EMA | 7 | 7.06 | 7.11 | | 12 day EMA | 7.23 | 7.29 | 7.35 | | 20 day EMA | 7.45 | 7.51 | 7.57 | | 35 day EMA | 7.7 | 7.75 | 7.8 | | 50 day EMA | 7.99 | 8.04 | 8.08 |
SMA (simple moving average) of Ofs Capital OFS
| SMA period | SMA current | SMA prev | SMA prev2 | | 5 day SMA | 7 | 7.07 | 7.12 | | 12 day SMA | 7.25 | 7.32 | 7.37 | | 20 day SMA | 7.48 | 7.55 | 7.62 | | 35 day SMA | 7.98 | 8.02 | 8.07 | | 50 day SMA | 8.08 | 8.11 | 8.14 | | 100 day SMA | 8.3 | 8.32 | 8.33 | | 150 day SMA | 8.44 | 8.45 | 8.47 | | 200 day SMA | 8.4 | 8.41 | 8.41 |
|
|
