OldDominion ODFL full analysis,charts,indicators,moving averages,SMA,DMA,EMA,ADX,MACD,RSIOld Dominion ODFL WideScreen charts, DMA,SMA,EMA technical analysis, forecast prediction, by indicators ADX,MACD,RSI,CCI USA stock exchange
operates under Transportation sector & deals in Trucking Freight Courier Services
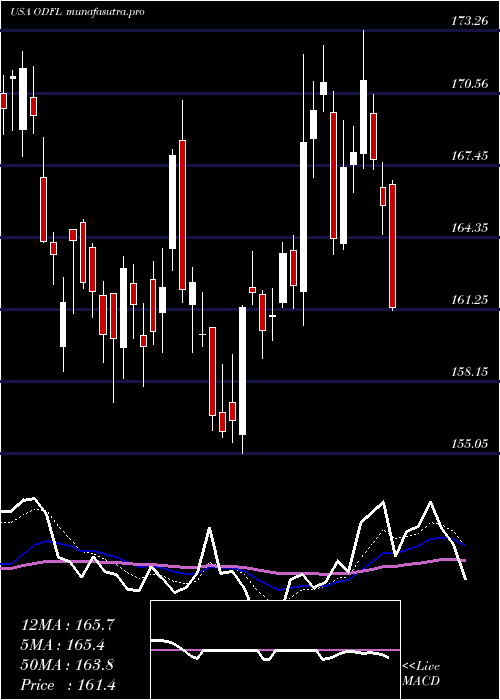
Daily price and charts and targets OldDominion Strong Daily Stock price targets for OldDominion ODFL are 142.05 and 147.31 | Daily Target 1 | 137.77 | | Daily Target 2 | 141.07 | | Daily Target 3 | 143.03333333333 | | Daily Target 4 | 146.33 | | Daily Target 5 | 148.29 |
Daily price and volume Old Dominion
| Date |
Closing |
Open |
Range |
Volume |
Tue 21 October 2025 |
144.36 (2.59%) |
140.14 |
139.74 - 145.00 |
0.9179 times |
Mon 20 October 2025 |
140.71 (1.93%) |
138.58 |
137.68 - 142.31 |
0.99 times |
Fri 17 October 2025 |
138.04 (-0.04%) |
138.73 |
136.00 - 138.95 |
0.9216 times |
Thu 16 October 2025 |
138.10 (2.27%) |
139.89 |
135.50 - 140.49 |
1.1465 times |
Wed 15 October 2025 |
135.04 (-0.29%) |
135.46 |
134.78 - 137.87 |
0.9286 times |
Tue 14 October 2025 |
135.43 (-0.55%) |
134.71 |
134.03 - 137.48 |
1.2952 times |
Mon 13 October 2025 |
136.18 (1.39%) |
135.56 |
135.25 - 137.90 |
0.6319 times |
Fri 10 October 2025 |
134.31 (-4.93%) |
141.85 |
134.20 - 142.69 |
1.0526 times |
Thu 09 October 2025 |
141.28 (-2.42%) |
144.50 |
140.10 - 144.88 |
1.0099 times |
Wed 08 October 2025 |
144.78 (2.42%) |
140.64 |
139.54 - 146.94 |
1.1058 times |
Tue 07 October 2025 |
141.36 (-0.58%) |
142.64 |
140.29 - 144.61 |
0.7284 times |
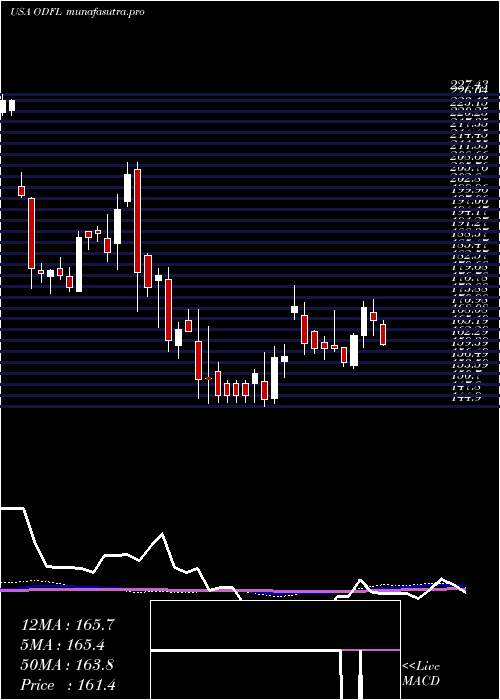
Weekly price and charts OldDominion Strong weekly Stock price targets for OldDominion ODFL are 141.02 and 148.34 | Weekly Target 1 | 135.03 | | Weekly Target 2 | 139.69 | | Weekly Target 3 | 142.34666666667 | | Weekly Target 4 | 147.01 | | Weekly Target 5 | 149.67 |
Weekly price and volumes for Old Dominion
| Date |
Closing |
Open |
Range |
Volume |
Tue 21 October 2025 |
144.36 (4.58%) |
138.58 |
137.68 - 145.00 |
0.4667 times |
Fri 17 October 2025 |
138.04 (2.78%) |
135.56 |
134.03 - 140.49 |
1.2044 times |
Fri 10 October 2025 |
134.31 (-4.97%) |
141.78 |
134.20 - 146.94 |
1.0705 times |
Fri 03 October 2025 |
141.33 (1.98%) |
139.64 |
136.60 - 145.21 |
1.2106 times |
Fri 26 September 2025 |
138.59 (-1.6%) |
140.83 |
133.69 - 143.40 |
1.3401 times |
Fri 19 September 2025 |
140.84 (-2.8%) |
145.33 |
140.09 - 149.88 |
1.4167 times |
Fri 12 September 2025 |
144.89 (-3.86%) |
150.90 |
144.46 - 151.29 |
0.9232 times |
Fri 05 September 2025 |
150.71 (-0.17%) |
148.65 |
140.71 - 154.15 |
1.0193 times |
Fri 29 August 2025 |
150.97 (0%) |
149.62 |
148.20 - 151.13 |
0.2024 times |
Fri 29 August 2025 |
150.97 (-5.13%) |
158.52 |
147.44 - 158.87 |
1.1461 times |
Fri 22 August 2025 |
159.13 (5.29%) |
151.32 |
147.17 - 160.06 |
1.1594 times |
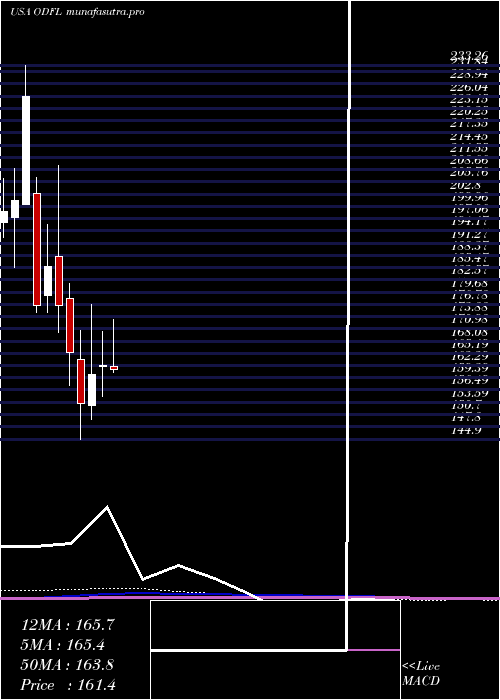
Monthly price and charts OldDominion Strong monthly Stock price targets for OldDominion ODFL are 139.2 and 152.11 | Monthly Target 1 | 128.87 | | Monthly Target 2 | 136.61 | | Monthly Target 3 | 141.77666666667 | | Monthly Target 4 | 149.52 | | Monthly Target 5 | 154.69 |
Monthly price and volumes Old Dominion
| Date |
Closing |
Open |
Range |
Volume |
Tue 21 October 2025 |
144.36 (2.54%) |
139.35 |
134.03 - 146.94 |
0.7497 times |
Tue 30 September 2025 |
140.78 (-6.75%) |
148.65 |
133.69 - 154.15 |
1.1902 times |
Fri 29 August 2025 |
150.97 (1.15%) |
148.14 |
140.91 - 160.06 |
1.0845 times |
Thu 31 July 2025 |
149.25 (-8.04%) |
162.05 |
144.50 - 174.79 |
1.0624 times |
Mon 30 June 2025 |
162.30 (1.33%) |
161.95 |
155.05 - 170.26 |
0.9082 times |
Fri 30 May 2025 |
160.17 (4.5%) |
152.86 |
149.61 - 176.85 |
0.9819 times |
Wed 30 April 2025 |
153.28 (-7.36%) |
163.67 |
144.90 - 170.58 |
1.1771 times |
Mon 31 March 2025 |
165.45 (-6.26%) |
178.18 |
157.67 - 181.76 |
0.9855 times |
Fri 28 February 2025 |
176.50 (-4.91%) |
188.13 |
170.00 - 209.61 |
1.0583 times |
Fri 31 January 2025 |
185.61 (5.22%) |
178.93 |
174.85 - 195.73 |
0.8024 times |
Tue 31 December 2024 |
176.40 (-21.94%) |
203.10 |
174.80 - 206.86 |
0.6202 times |
DMA SMA EMA moving averages of Old Dominion ODFL
DMA (daily moving average) of Old Dominion ODFL
| DMA period | DMA value | | 5 day DMA | 139.25 | | 12 day DMA | 139.32 | | 20 day DMA | 139.74 | | 35 day DMA | 142.23 | | 50 day DMA | 145.27 | | 100 day DMA | 152.79 | | 150 day DMA | 154.8 | | 200 day DMA | 162.41 | EMA (exponential moving average) of Old Dominion ODFL
| EMA period | EMA current | EMA prev | EMA prev2 | | 5 day EMA | 140.47 | 138.52 | 137.42 | | 12 day EMA | 139.67 | 138.82 | 138.48 | | 20 day EMA | 140.32 | 139.89 | 139.8 | | 35 day EMA | 142.43 | 142.32 | 142.42 | | 50 day EMA | 144.79 | 144.81 | 144.98 |
SMA (simple moving average) of Old Dominion ODFL
| SMA period | SMA current | SMA prev | SMA prev2 | | 5 day SMA | 139.25 | 137.46 | 136.56 | | 12 day SMA | 139.32 | 139.06 | 139.05 | | 20 day SMA | 139.74 | 139.49 | 139.4 | | 35 day SMA | 142.23 | 142.39 | 142.68 | | 50 day SMA | 145.27 | 145.36 | 145.41 | | 100 day SMA | 152.79 | 152.97 | 153.2 | | 150 day SMA | 154.8 | 154.94 | 155.09 | | 200 day SMA | 162.41 | 162.59 | 162.77 |
|
|
