OceanfirstFinancial OCFC full analysis,charts,indicators,moving averages,SMA,DMA,EMA,ADX,MACD,RSIOceanfirst Financial OCFC WideScreen charts, DMA,SMA,EMA technical analysis, forecast prediction, by indicators ADX,MACD,RSI,CCI USA stock exchange
operates under Finance sector & deals in Savings Institutions
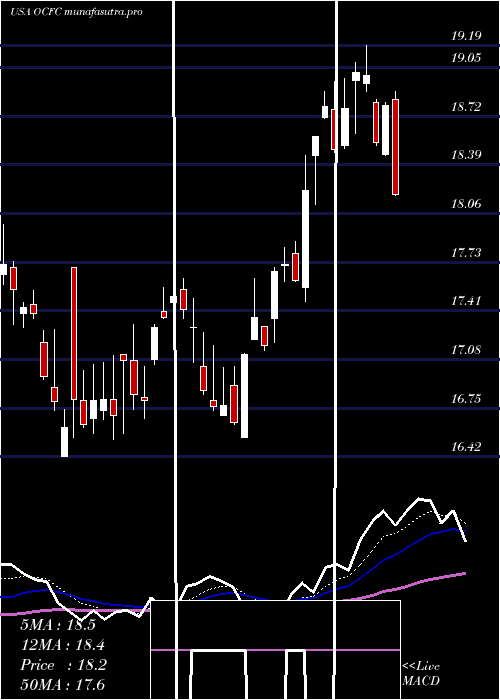
Daily price and charts and targets OceanfirstFinancial Strong Daily Stock price targets for OceanfirstFinancial OCFC are 19.43 and 19.71 | Daily Target 1 | 19.23 | | Daily Target 2 | 19.35 | | Daily Target 3 | 19.506666666667 | | Daily Target 4 | 19.63 | | Daily Target 5 | 19.79 |
Daily price and volume Oceanfirst Financial
| Date |
Closing |
Open |
Range |
Volume |
Thu 04 December 2025 |
19.48 (0.26%) |
19.43 |
19.38 - 19.66 |
0.8563 times |
Wed 03 December 2025 |
19.43 (1.83%) |
19.10 |
19.00 - 19.57 |
0.892 times |
Tue 02 December 2025 |
19.08 (0.42%) |
19.08 |
18.96 - 19.22 |
0.8523 times |
Mon 01 December 2025 |
19.00 (0.8%) |
18.67 |
18.67 - 19.18 |
1.118 times |
Fri 28 November 2025 |
18.85 (-0.11%) |
18.91 |
18.80 - 19.04 |
0.5842 times |
Wed 26 November 2025 |
18.87 (-0.53%) |
18.87 |
18.78 - 19.06 |
0.8797 times |
Tue 25 November 2025 |
18.97 (3.55%) |
18.49 |
17.94 - 19.09 |
0.8874 times |
Mon 24 November 2025 |
18.32 (0.66%) |
18.16 |
17.76 - 18.42 |
1.2342 times |
Fri 21 November 2025 |
18.20 (4.72%) |
17.40 |
17.40 - 18.45 |
1.3618 times |
Thu 20 November 2025 |
17.38 (-1.53%) |
17.76 |
17.32 - 18.18 |
1.334 times |
Wed 19 November 2025 |
17.65 (0%) |
17.65 |
17.42 - 17.90 |
1.0416 times |
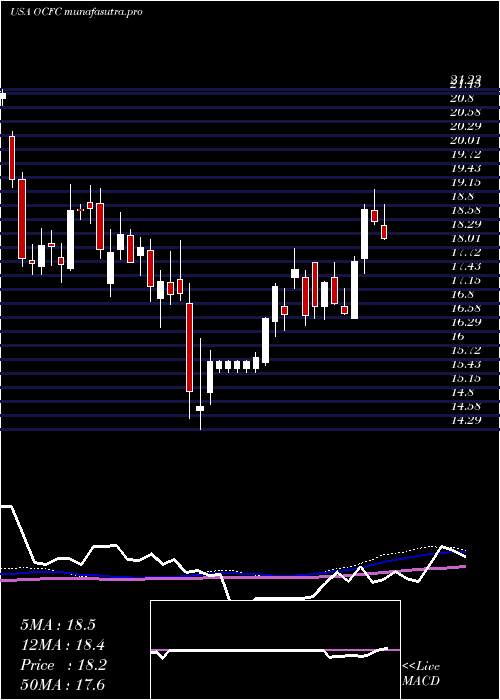
Weekly price and charts OceanfirstFinancial Strong weekly Stock price targets for OceanfirstFinancial OCFC are 19.08 and 20.07 | Weekly Target 1 | 18.28 | | Weekly Target 2 | 18.88 | | Weekly Target 3 | 19.27 | | Weekly Target 4 | 19.87 | | Weekly Target 5 | 20.26 |
Weekly price and volumes for Oceanfirst Financial
| Date |
Closing |
Open |
Range |
Volume |
Thu 04 December 2025 |
19.48 (3.34%) |
18.67 |
18.67 - 19.66 |
0.5983 times |
Fri 28 November 2025 |
18.85 (3.57%) |
18.16 |
17.76 - 19.09 |
0.5769 times |
Fri 21 November 2025 |
18.20 (1.51%) |
17.95 |
17.05 - 18.45 |
1.1465 times |
Fri 14 November 2025 |
17.93 (0.39%) |
17.93 |
17.75 - 18.66 |
0.957 times |
Fri 07 November 2025 |
17.86 (-1.76%) |
17.96 |
17.77 - 18.38 |
0.8279 times |
Fri 31 October 2025 |
18.18 (0%) |
18.33 |
18.14 - 18.50 |
0.2296 times |
Fri 31 October 2025 |
18.18 (-2.73%) |
18.75 |
18.14 - 19.46 |
1.4663 times |
Fri 24 October 2025 |
18.69 (5.65%) |
17.86 |
17.82 - 19.50 |
1.8255 times |
Fri 17 October 2025 |
17.69 (-0.23%) |
17.98 |
17.32 - 18.87 |
1.0154 times |
Fri 10 October 2025 |
17.73 (-0.67%) |
17.99 |
17.70 - 19.39 |
1.3565 times |
Fri 03 October 2025 |
17.85 (-0.39%) |
17.97 |
17.16 - 18.04 |
0.5962 times |
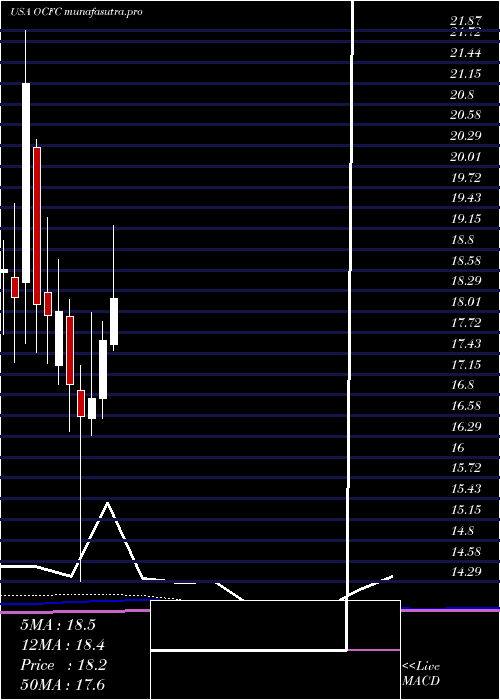
Monthly price and charts OceanfirstFinancial Strong monthly Stock price targets for OceanfirstFinancial OCFC are 19.08 and 20.07 | Monthly Target 1 | 18.28 | | Monthly Target 2 | 18.88 | | Monthly Target 3 | 19.27 | | Monthly Target 4 | 19.87 | | Monthly Target 5 | 20.26 |
Monthly price and volumes Oceanfirst Financial
| Date |
Closing |
Open |
Range |
Volume |
Thu 04 December 2025 |
19.48 (3.34%) |
18.67 |
18.67 - 19.66 |
0.1817 times |
Fri 28 November 2025 |
18.85 (3.69%) |
17.96 |
17.05 - 19.09 |
1.0655 times |
Fri 31 October 2025 |
18.18 (3.47%) |
17.40 |
17.16 - 19.50 |
1.893 times |
Tue 30 September 2025 |
17.57 (-4.46%) |
18.20 |
17.31 - 18.91 |
0.955 times |
Fri 29 August 2025 |
18.39 (9.59%) |
16.61 |
16.09 - 18.75 |
1.0054 times |
Thu 31 July 2025 |
16.78 (-4.71%) |
17.56 |
16.67 - 19.43 |
1.031 times |
Mon 30 June 2025 |
17.61 (4.76%) |
16.81 |
16.54 - 17.87 |
0.9289 times |
Fri 30 May 2025 |
16.81 (1.51%) |
16.54 |
16.31 - 17.99 |
0.9652 times |
Wed 30 April 2025 |
16.56 (-2.65%) |
16.92 |
14.29 - 17.27 |
1.1001 times |
Mon 31 March 2025 |
17.01 (-5.55%) |
17.94 |
16.36 - 18.18 |
0.8743 times |
Fri 28 February 2025 |
18.01 (0.28%) |
17.27 |
17.01 - 18.72 |
0.9352 times |
DMA SMA EMA moving averages of Oceanfirst Financial OCFC
DMA (daily moving average) of Oceanfirst Financial OCFC
| DMA period | DMA value | | 5 day DMA | 19.17 | | 12 day DMA | 18.57 | | 20 day DMA | 18.33 | | 35 day DMA | 18.37 | | 50 day DMA | 18.24 | | 100 day DMA | 18 | | 150 day DMA | 17.8 | | 200 day DMA | 17.49 | EMA (exponential moving average) of Oceanfirst Financial OCFC
| EMA period | EMA current | EMA prev | EMA prev2 | | 5 day EMA | 19.19 | 19.04 | 18.85 | | 12 day EMA | 18.79 | 18.67 | 18.53 | | 20 day EMA | 18.57 | 18.47 | 18.37 | | 35 day EMA | 18.39 | 18.33 | 18.26 | | 50 day EMA | 18.33 | 18.28 | 18.23 |
SMA (simple moving average) of Oceanfirst Financial OCFC
| SMA period | SMA current | SMA prev | SMA prev2 | | 5 day SMA | 19.17 | 19.05 | 18.95 | | 12 day SMA | 18.57 | 18.38 | 18.26 | | 20 day SMA | 18.33 | 18.27 | 18.19 | | 35 day SMA | 18.37 | 18.34 | 18.32 | | 50 day SMA | 18.24 | 18.21 | 18.18 | | 100 day SMA | 18 | 17.99 | 17.98 | | 150 day SMA | 17.8 | 17.78 | 17.76 | | 200 day SMA | 17.49 | 17.48 | 17.47 |
|
|
